
Bitcoin (BTC) data flashed a rare bid-side imbalance when it traded below $65,000 on Sunday. The bid-ask ratio showed strong buying pressure across multiple depth levels, which may have confirmed a short-term bottom for BTC price.
With more than $1.6 billion in short leveraged positions at risk of liquidation near $71,000, the setup centers on the possibility of a relief rally if BTC can hold above $66,700 on the daily chart.
Bitcoin bid-ask imbalance meets market structure change
Data from Hyblock captured a sharp bid-side skew near $65,000 on Sunday. The imbalance ranked in the 99th percentile across the 1%, 2%, 5% and 10% orderbook depth, marking one of the strongest buying responses in recent weeks.
The order book depth tracks total buy and sell orders within a percentage range around price, offering a clear view of near-term liquidity pressure.
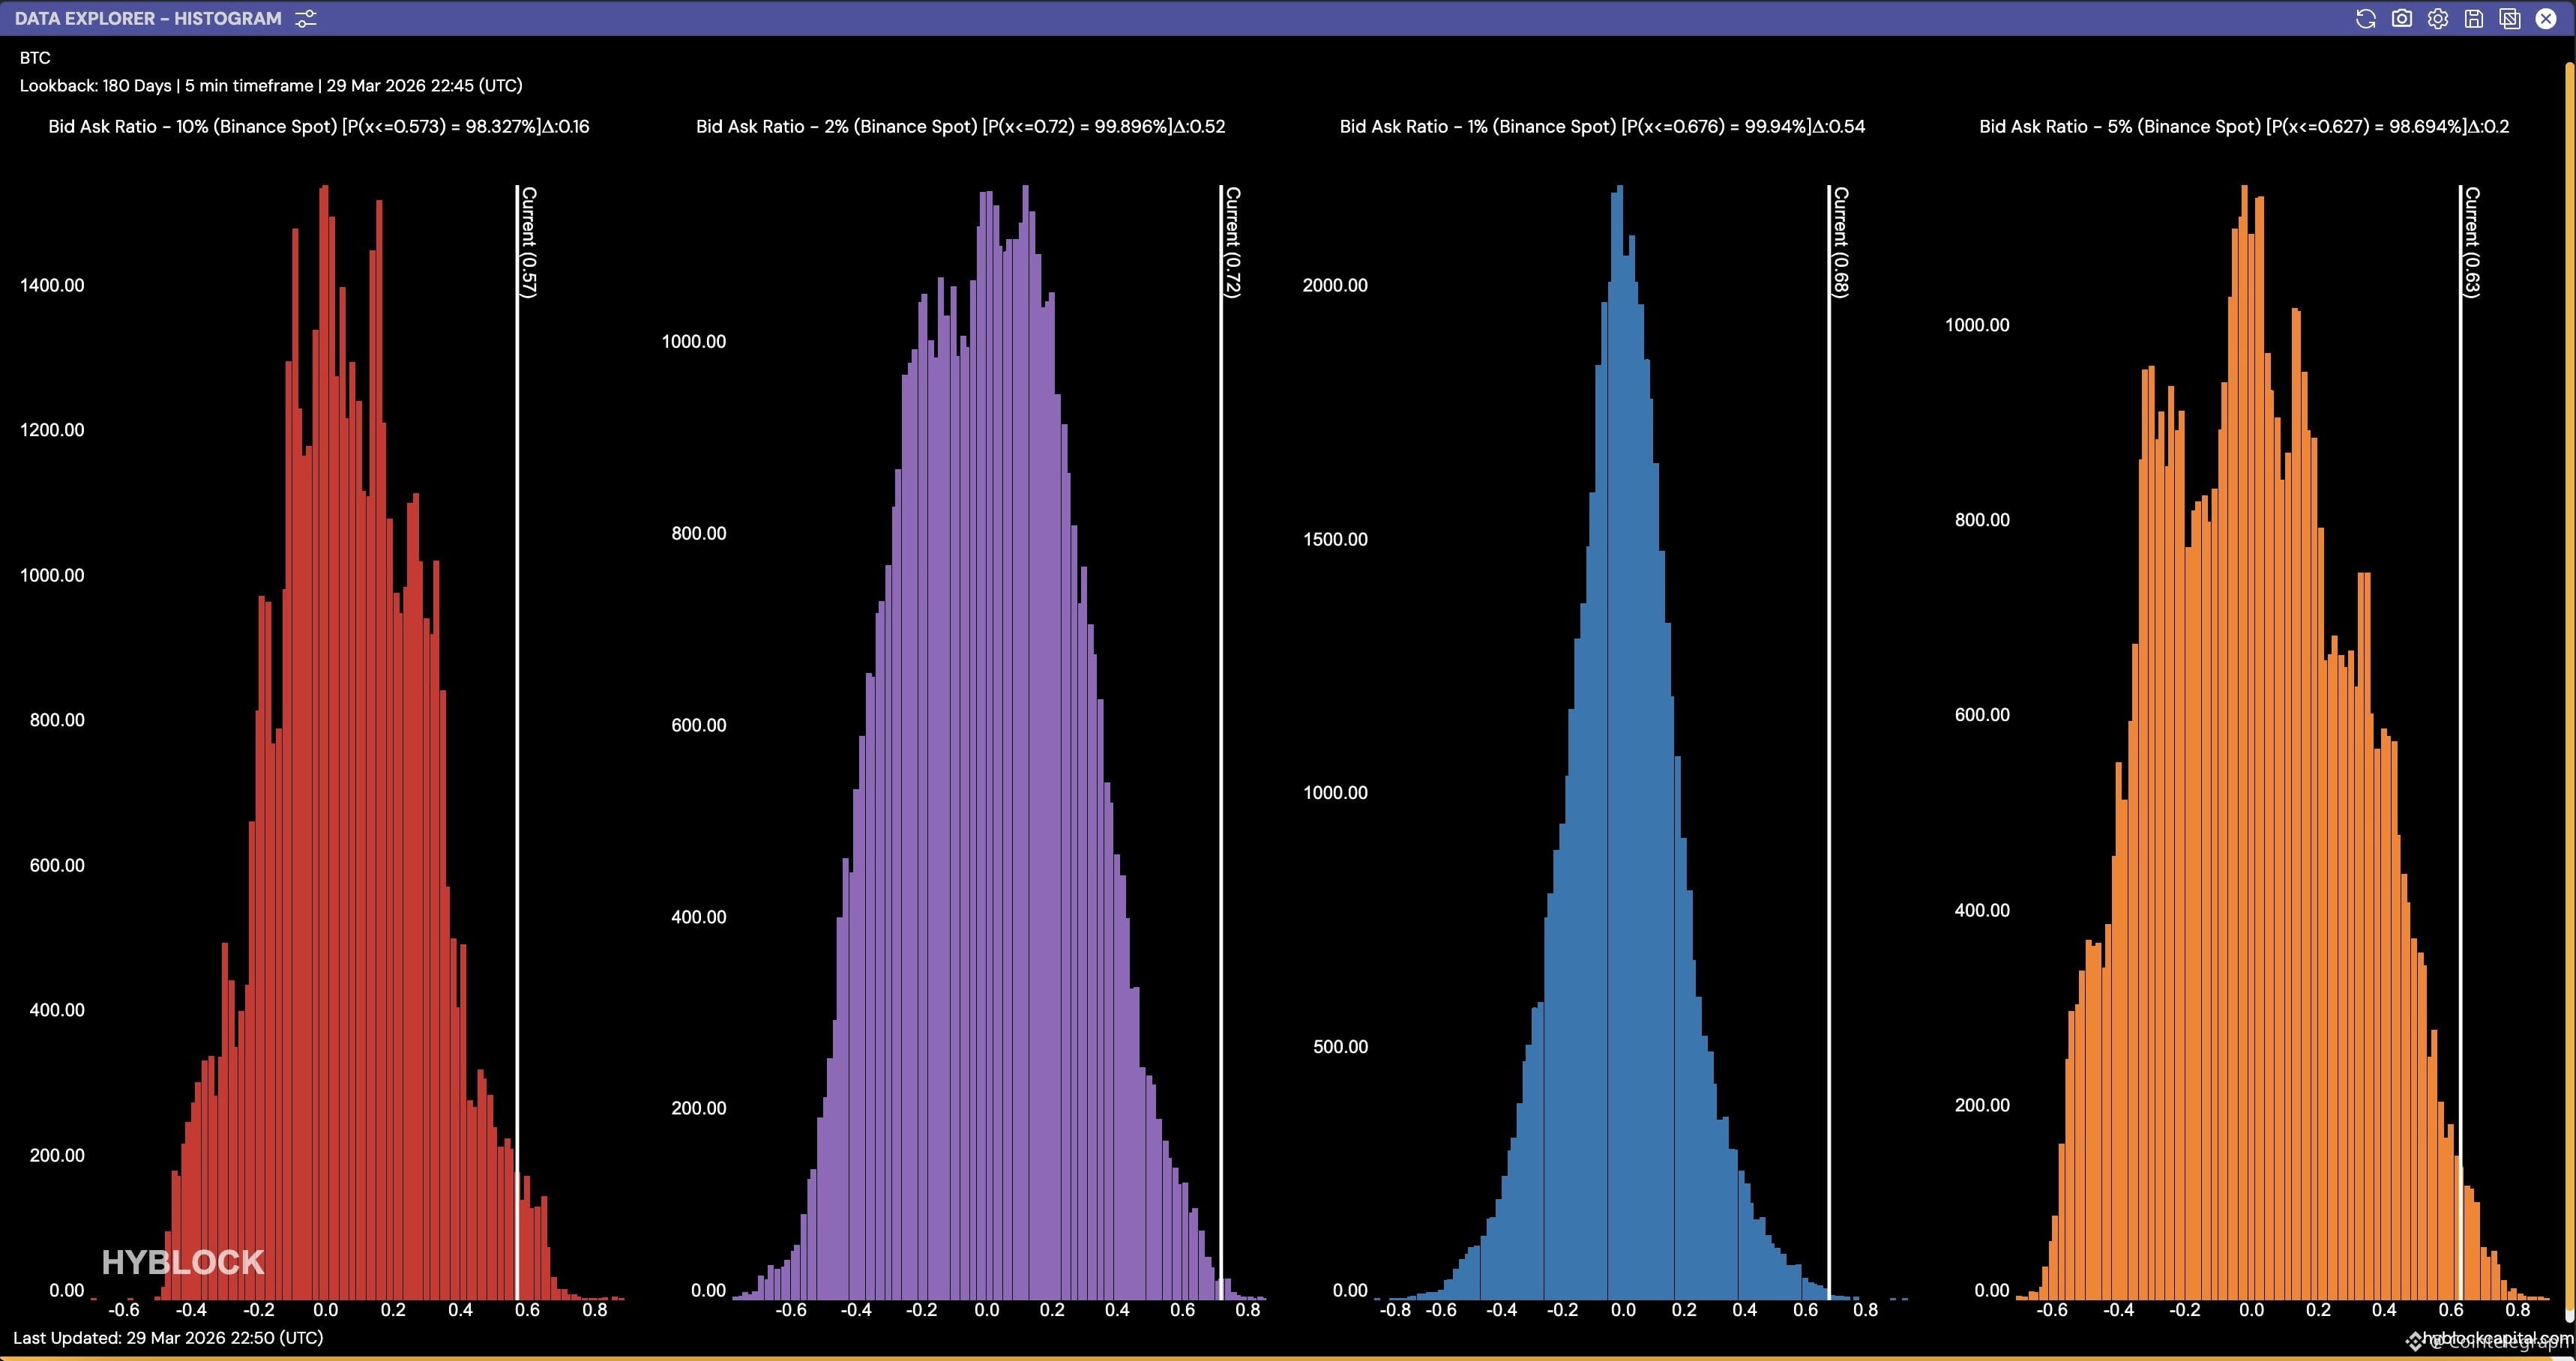 Bitcoin order-book depth bid-ask ratio. Source: Hyblock Capital
At that level, the bids outweighed asks across key zones, showing strong demand absorption. Bitcoin rebounded toward the $67,000–$68,000 range within hours, aligning with past cases where selling pressure faded quickly after similar extremes.
This indicates localized exhaustion in downside momentum, supported by the buyers stepping in at clustered liquidity zones.
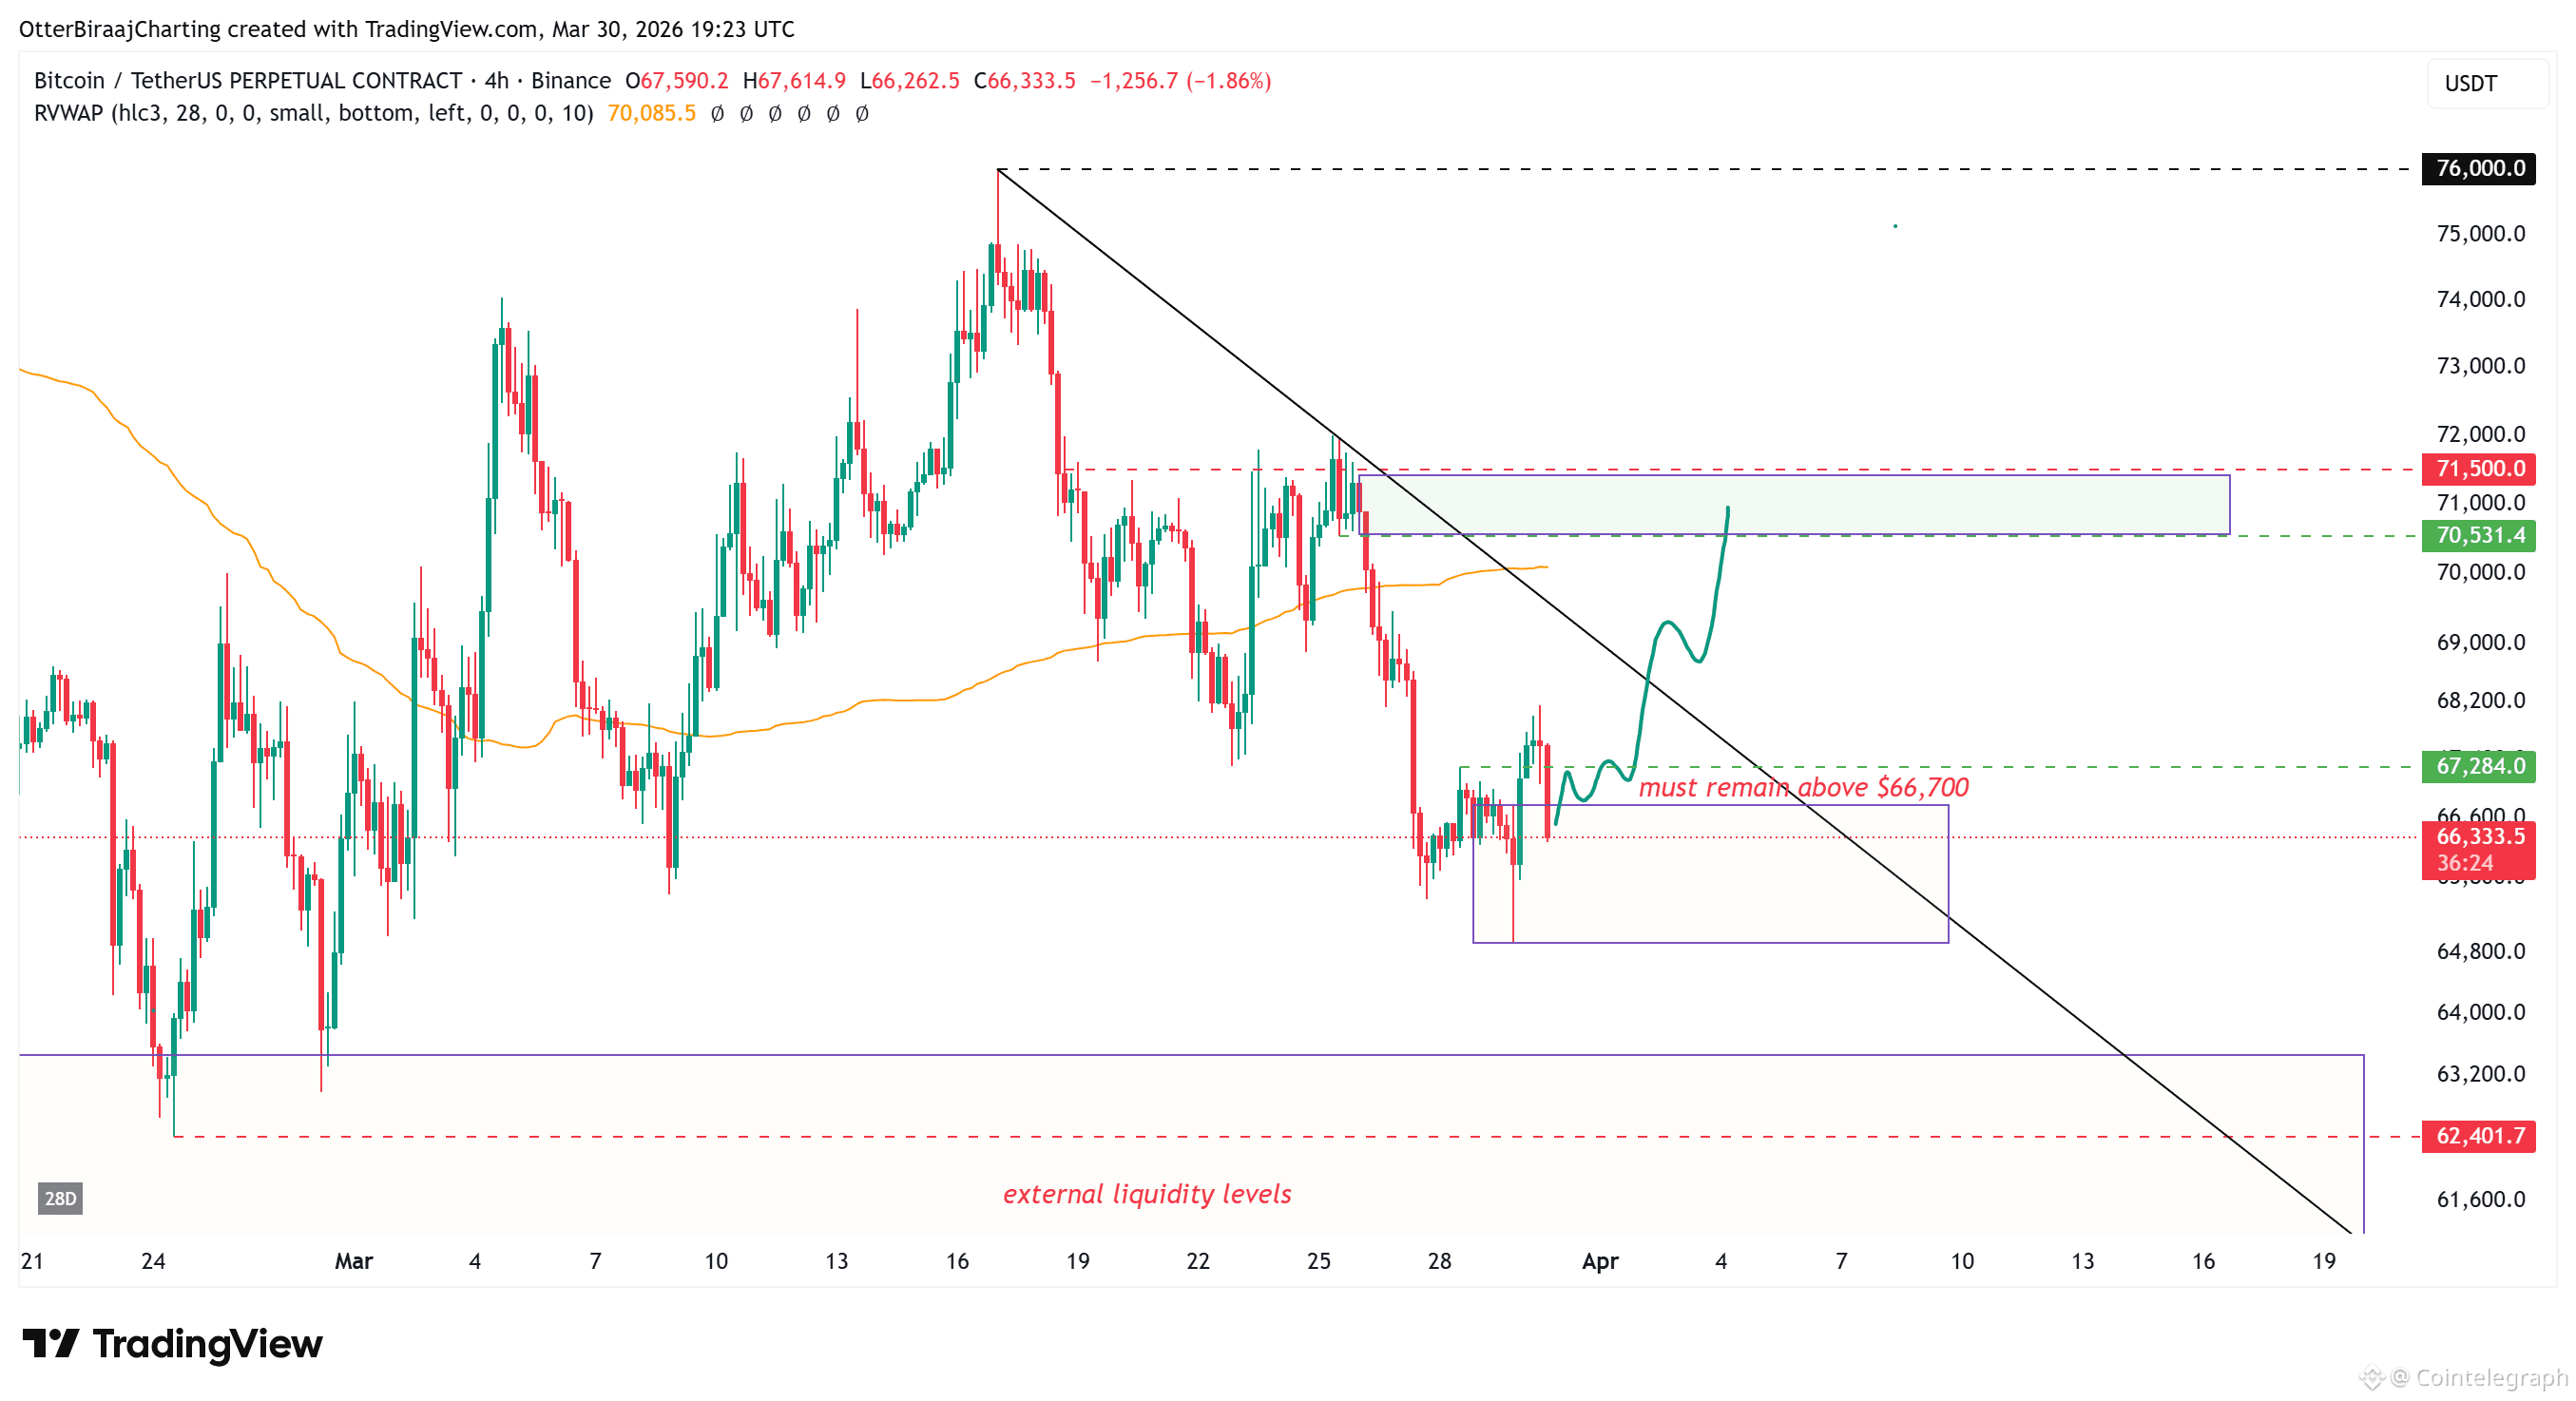 BTC/USDT 4-hour chart. Source: Cointelegraph/TradingView
On the technical side, a four-hour bullish break of structure adds confirmation to the trend shift. However, it is important to hold above $66,700 into the daily close on Monday to keep the setup intact.
The cumulative short liquidation leverage stacked near $71,000, estimated above $1.6 billion, outlines a visible upside target during the possible relief move.
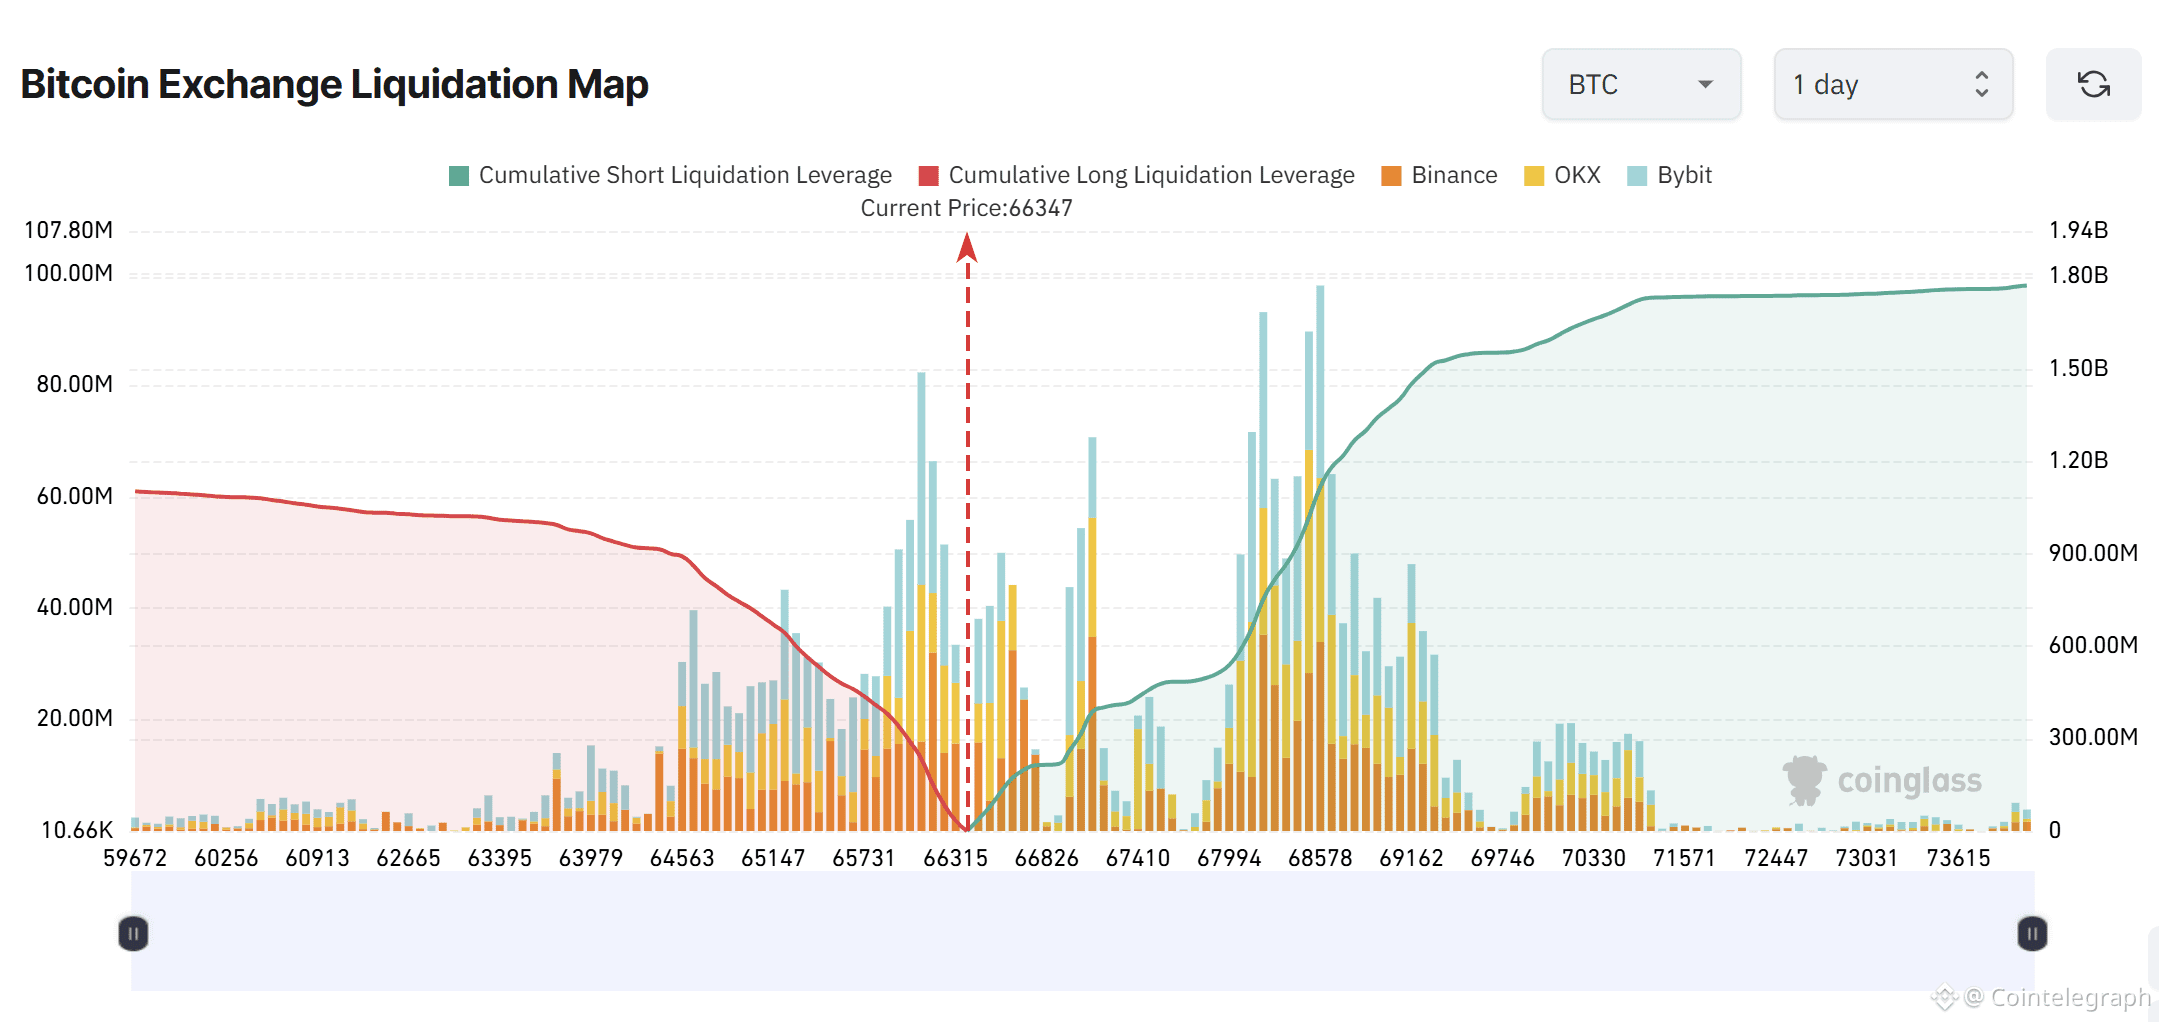 Bitcoin exchange liquidation map. Source: CoinGlass
Related: Bitcoin accumulation addresses absorb 67K BTC as miner-led selling falls: Data
April pivot trend meets Monday bearish pattern
A bullish positioning into April 1 adds a time-based variable. Crypto trader LP shows the first date of the month acting as a local low in 67% of observed cases over the past nine months.
The price direction into the pivot plays a role, with the downside approaches increasing the likelihood of a bottom formation, which is synonymous with the current setup.
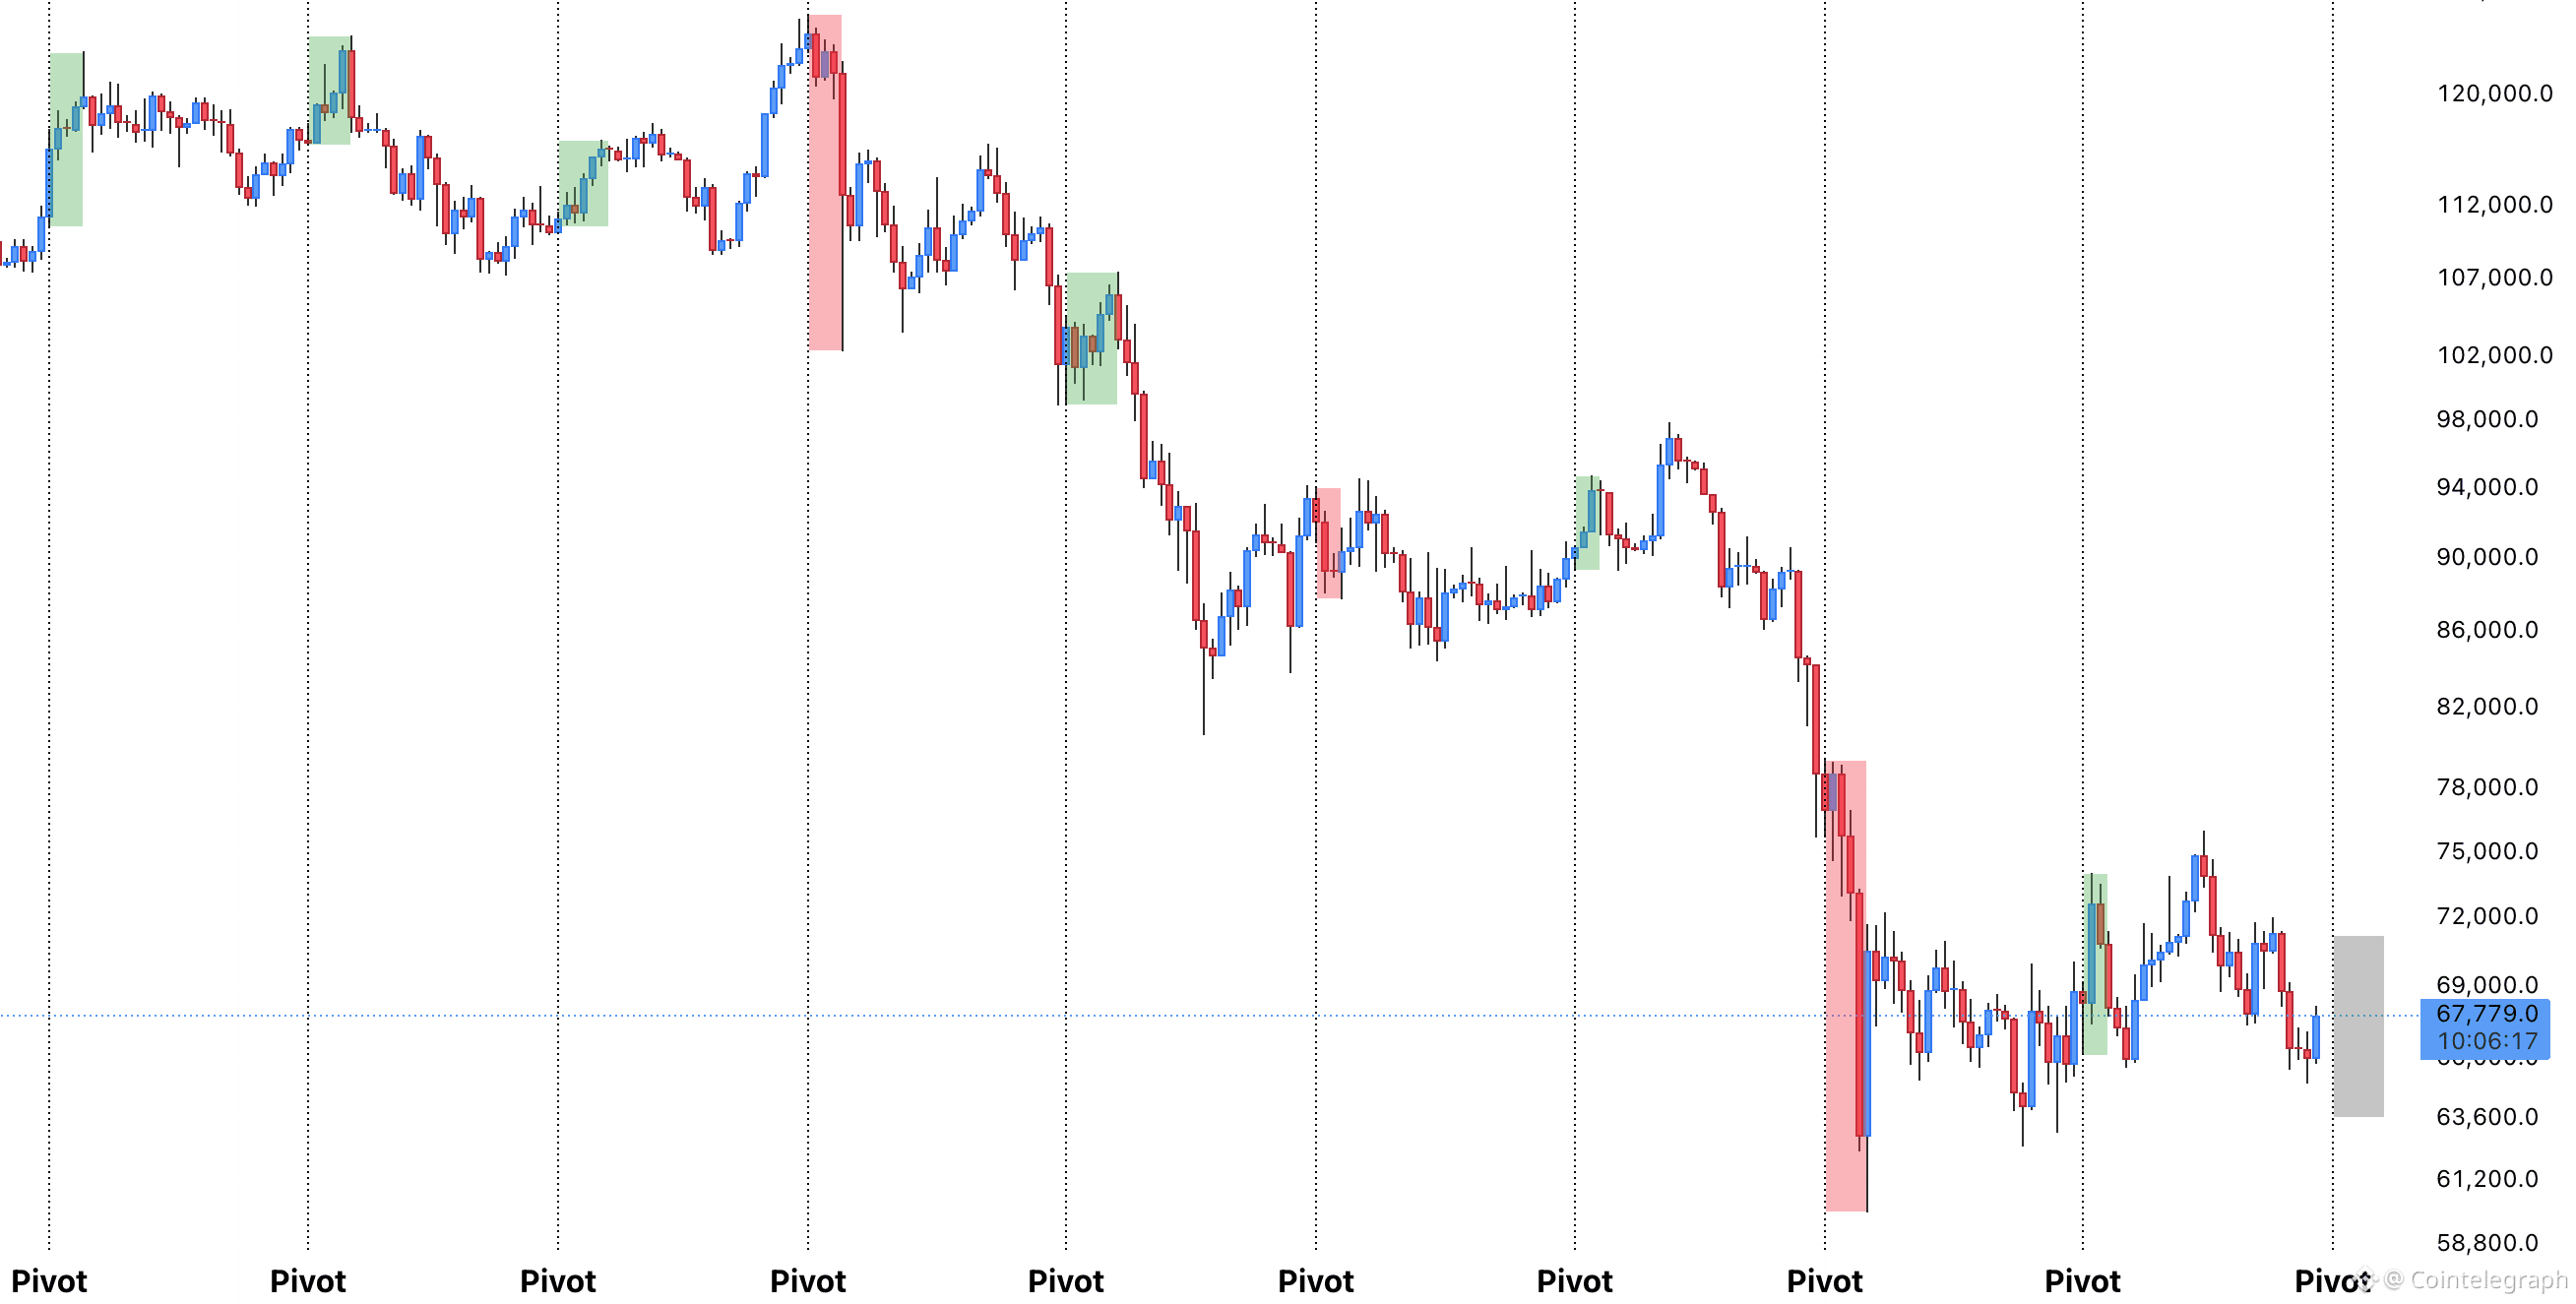 Bitcoin pivot trend analysis by LP. Source: X
At the same time, the recurring weekly behavior introduces a bit of resistance. Crypto analyst KillaXBT highlighted that roughly 90% of trading on Mondays printed early highs that were followed by selling pressure. Historical tracking showed 20 out of 24 Mondays delivered at least 3% downside moves over the past six months.
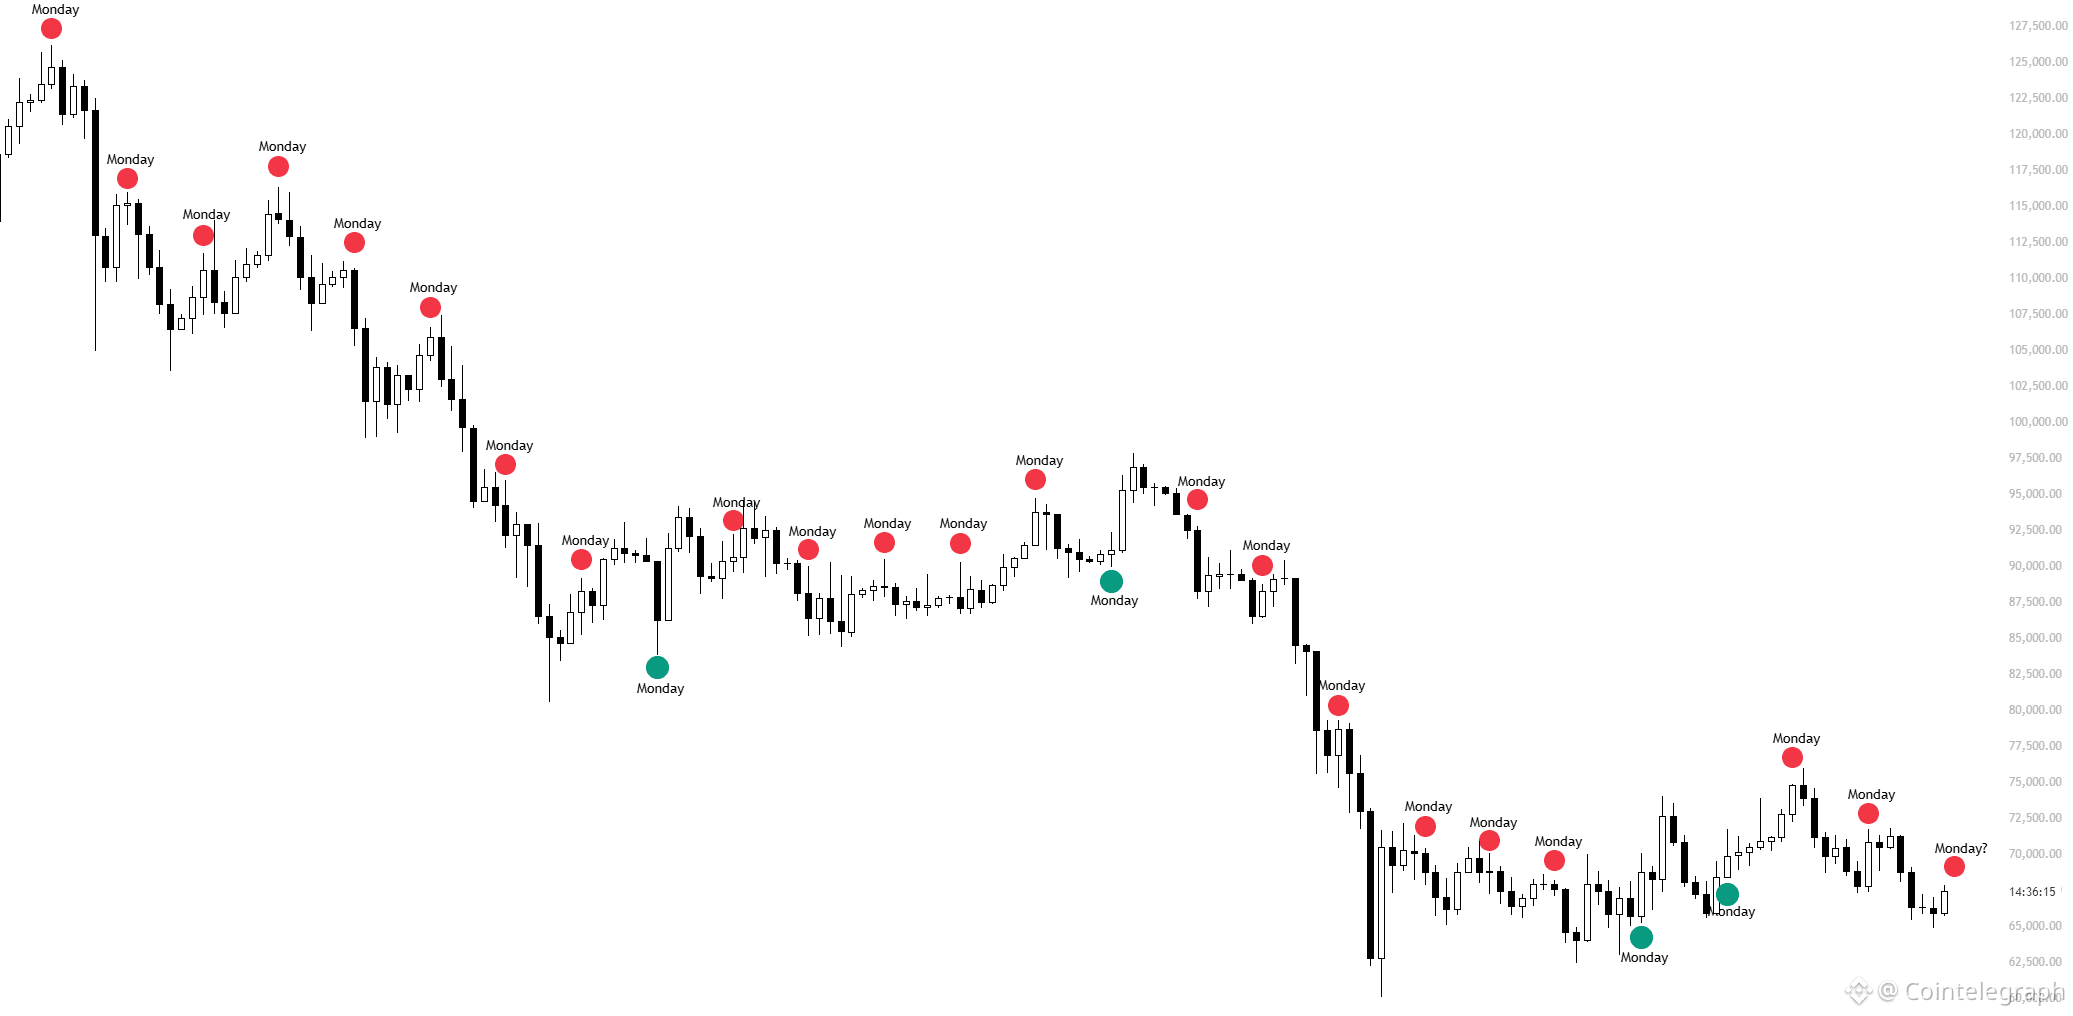 Monday high trend analysis by Killa. Source: X
These signals bring focus to the early-week price moves. Currently, Bitcoin is trading between a favorable April 1 setup and a common Monday weakness pattern, with $71,000 as the closest major liquidity level.
Related: Bitcoin analysis says $65K 'entry zone' with oil back above $100