At the time of writing, TRON (TRX) recorded an increase of 0.85% in the past week, becoming one of the few crypto assets in the top 20 market cap that maintained a positive trend. This altcoin previously climbed to a local peak of $0.317 on Friday (27/3), but quickly lost all its gains and adjusted down by 1.48% within 24 hours.
However, since the sharp drop in early February, TRON has shown a remarkable recovery on the price chart. Over more than 7 weeks, the increase reached 15.47%, while opening up expectations to retest the peak area in mid-January around the mark of $0.32.
At the present time, TRX has not yet established a clear trend, making this price area less attractive for short-term trading decisions.
Forming the price range and factors triggering the next movement of TRX
On the daily time frame (1D), the current trend still leans towards bullish as the MACD indicator shows upward momentum. The price is also approaching the peak area of a 4-month accumulation range, around the level of $0.319. Meanwhile, the bottom of this range is at $0.271 – which is also the starting point for the recovery after the crash in February.
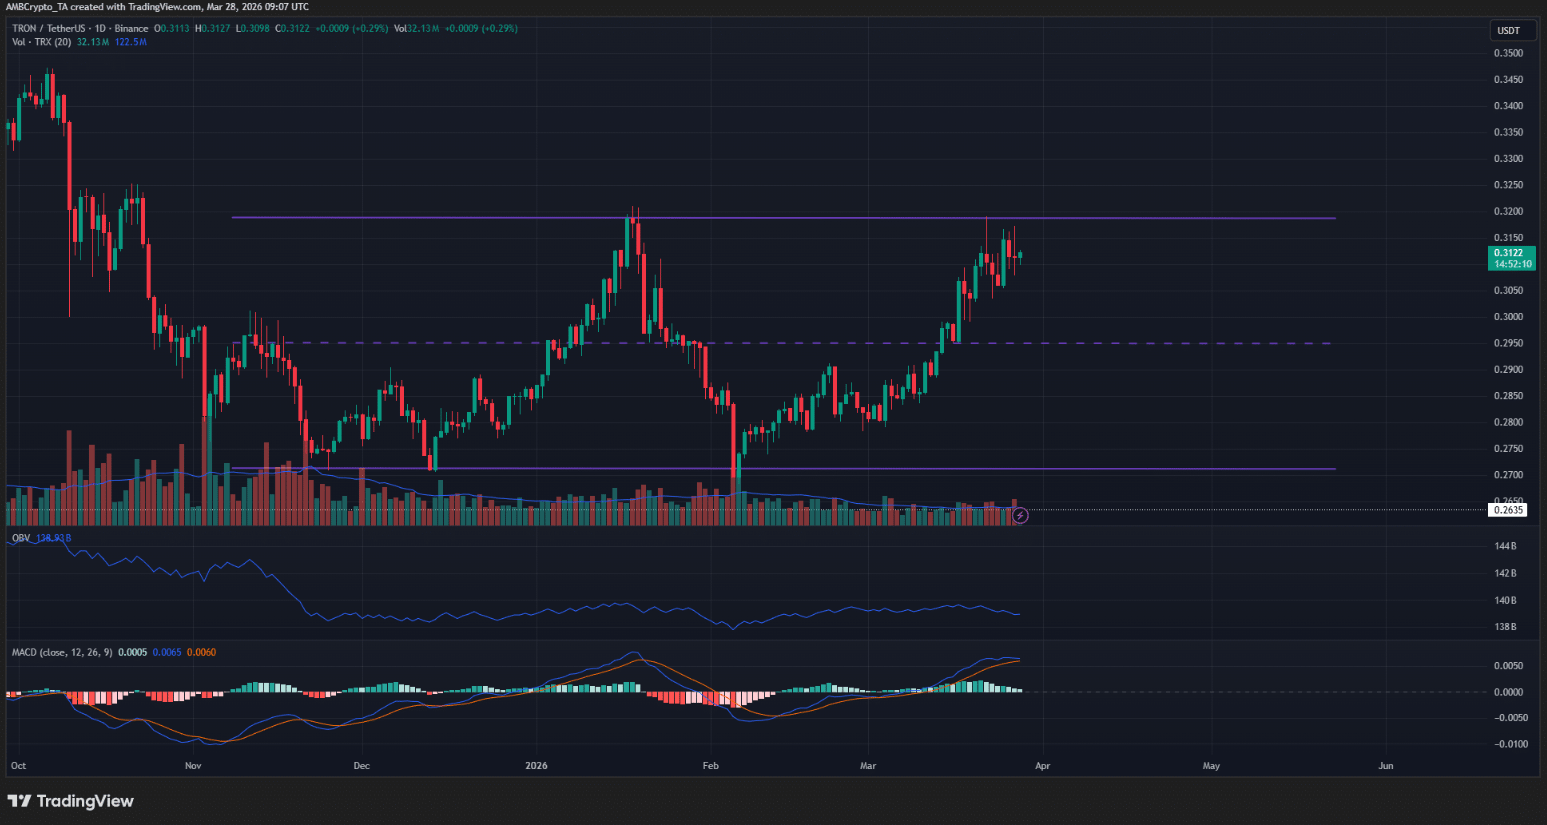 Daily TRX/USDT chart | Source: tradingView
Although TRX has recently shown relatively positive strength, this upward trend shows signs of weakening. The OBV indicator has not set a new peak in the past few weeks, reflecting that buying pressure is still not strong enough. Conversely, if the OBV surpasses to create a new peak, it will be a signal reinforcing the potential for a breakout.
The lack of momentum from the OBV is likely due to TRON's market liquidity maintaining at an average level since December. Price increases during this period have occurred without a significant increase in trading volume, causing the upward momentum to lack a solid foundation.
Will trader sentiment shift to bearish or continue bullish?
On the 4-hour time frame, the current trend still leans towards bullish as the MACD indicator shows upward momentum. The price is also approaching the peak area of a 4-month accumulation range, around the level of $0.319. Meanwhile, the bottom of this range is at $0.271 – which is also the starting point for the recovery after the crash in February.
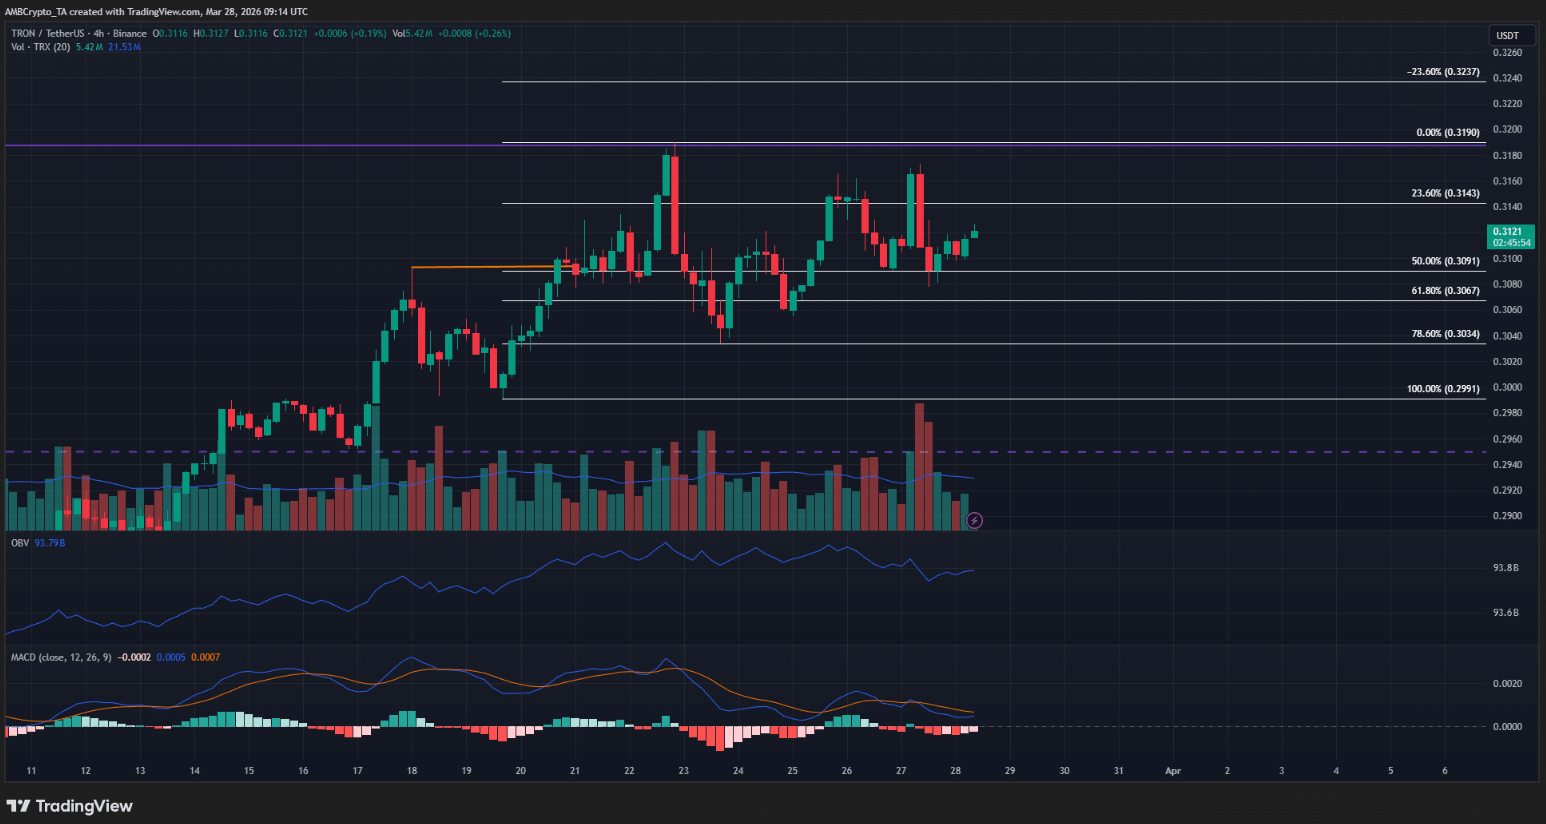 TRX/USDT 4-hour chart | Source: tradingView
Although TRX has recently shown relatively positive strength, this upward trend shows signs of weakening. The OBV indicator has not set a new peak in the past few weeks, reflecting that buying pressure is still not strong enough. Conversely, if the OBV surpasses to create a new peak, it will be a signal reinforcing the potential for a breakout.
The lack of momentum from the OBV is likely due to TRON's market liquidity maintaining at an average level since December. Price increases during this period have occurred without a significant increase in trading volume, causing the upward momentum to lack a solid foundation.
https://coinphoton.com/dong-tien-trx-suy-yeu-kich-ban-but-pha-ngan-han-doi-mat-thach-thuc.html