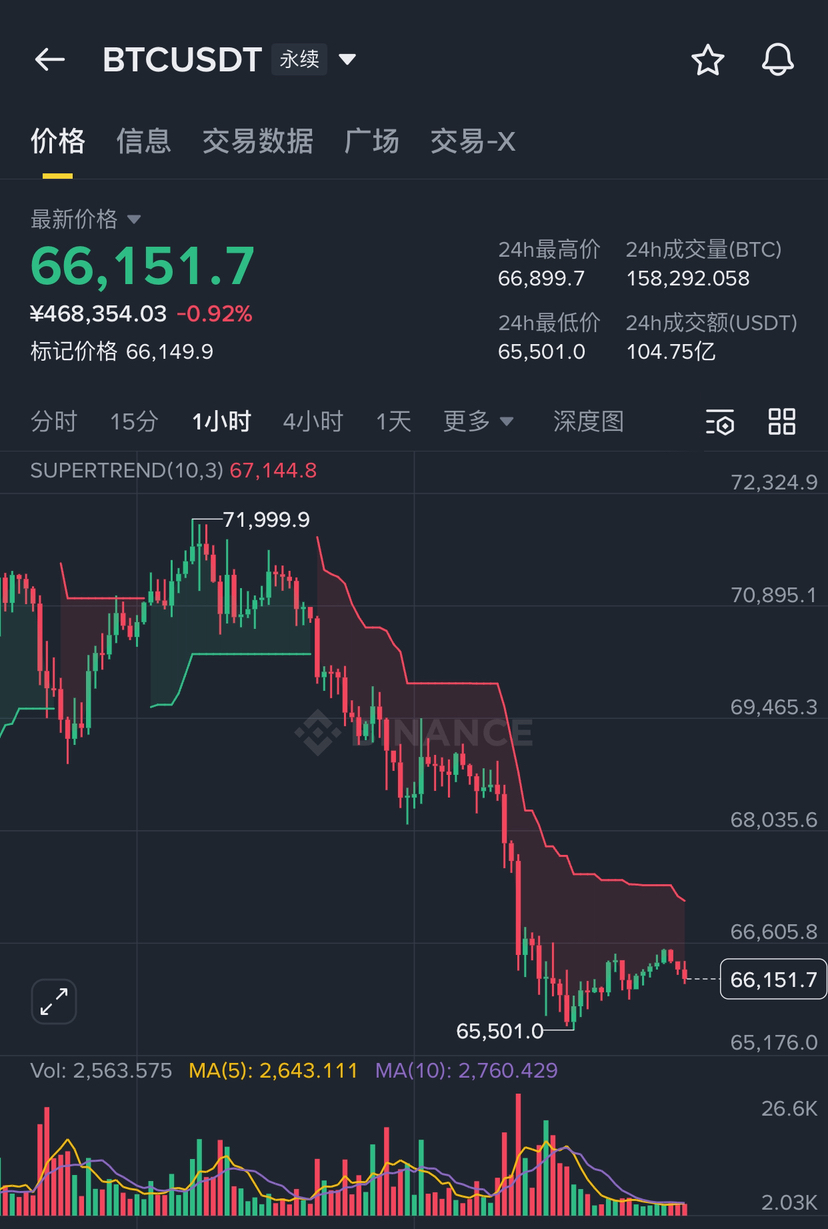
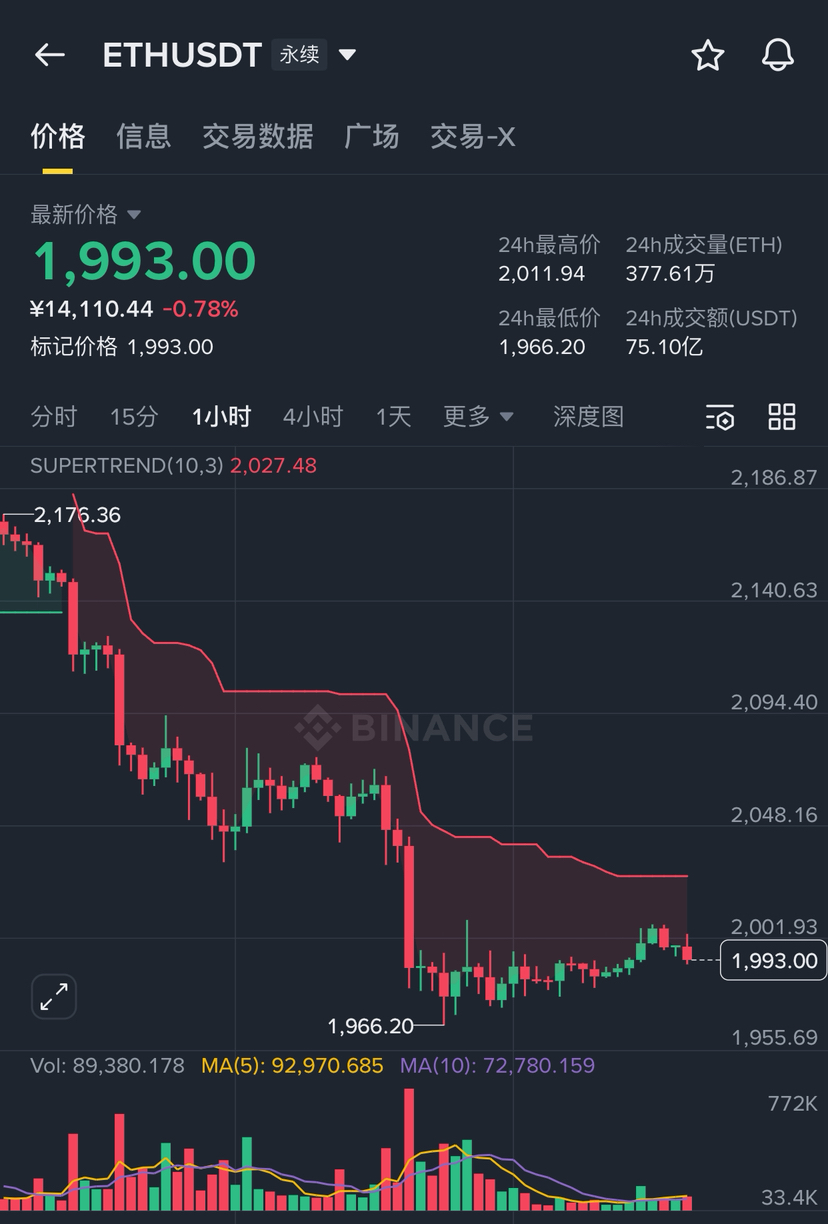
Two days ago, it was said that the volume would crash, and the bears were dominant. Today, the decline continues. Bitcoin 66,151, Ethereum 1,993, both broke through important levels—Bitcoin is only 650 dollars away from the previous low of 67,300, and Ethereum has directly broken through the 2,000 integer level, now at 1,993, with 2,000 becoming the resistance above. SuperTrend 1H is all deep red, and the resistance line is pressing down with the price, leaving the bulls completely powerless.
This chart of Bitcoin is a textbook example of stepwise decline. Starting from the high point of 71,999, the SuperTrend resistance line has been stepping down, and the price is being tightly pressed. The current resistance is at 67,144, with the current price at 66,151, nearly 1,000 dollars below the resistance. Today's lowest price is 65,501, already approaching the previous low below 67,300. Volume is 2,563, MA5 is 2,643, MA10 is 2,760, and the volume is below the moving averages, indicating that this decline is a shrinking bearish trend—no one is buying, and it slowly slides down like this, which is more painful than a heavy sell-off because you don't know where the bottom is.
Ethereum breaking below 2,000 is a serious signal. From the high of 2,176, it has been stepping down, with SuperTrend resistance following to 2,027. The current price of 1,993 is 34 dollars below resistance. Today's low was 1,966, and now it has slightly rebounded to 1,993, but the 24-hour high was only 2,011, failing to stabilize above 2,000. The volume is 89,380, MA5 is 92,970, MA10 is 72,780; the volume is close to the moving averages, indicating some buying support here, but it's still not enough to confirm a bottom. 2,000 has changed from support to resistance, which is a significant psychological blow to bulls.
The core issue in the two charts: Continuous decreasing volume and bearish trend, SuperTrend deep red, key support continuously lost; it is still too early to discuss bottom fishing.
📊 [BTC Script Simulation] Current price 66,151
📉 50% chance: Breaking below the low of 65,501, testing the integer level of 65,000
Decreasing volume and bearish trend is the most dangerous—no one is buying, and the price just slides down. If the low of 65,501 breaks today, 65,000 is the closest integer support below; there will be a pile of stop-loss and bottom-fishing orders there, whether it can hold will be revealed in time.
⚖️ 25% chance: Range trading between 65,500–67,000
Grinding back and forth near the low, trading volume continues to shrink, both bulls and bears lack strength, waiting for an external direction to break the deadlock. However, the SuperTrend red pressure is looming; horizontal movement may break downward at any time.
🚀 15% chance: Volume rebound, reclaiming resistance at 67,144
A sudden return of volume is needed to break through the SuperTrend resistance. Today's high of 66,899 failed to exceed 67,000, making it very challenging. Its occurrence is a good sign, but don't bet on this probability.
☠️ 10% chance: Accelerating break below 65,000, heading towards 63,000–64,000
If 65,000 cannot hold, the space below opens wide. The last relatively strong support range is around 63,000–64,000, and the drop will look very unpleasant.
📊 [ETH Script Simulation] Current price 1,993 (breaking below 2,000!)
📉 50% chance: Rebound at 2,000 fails, second dip to the low of 1,966
2,000 is now resistance, not support; today's high was only 2,011 before coming back down, indicating someone is guarding the exit above. The low of 1,966 faces a second test; if it can't hold, look for 1,950 or even 1,900.
⚖️ 25% chance: Range trading between 1,966–2,011
Wandering back and forth between today's high and low, waiting for BTC to make a statement. Ethereum has no independent market, it is even less stable if BTC is unstable.
🚀 15% chance: Effectively stabilizing above 2,000, testing resistance at 2,027
If BTC can stabilize and rebound, Ethereum is expected to rise again above 2,000, testing the SuperTrend resistance at 2,027. However, there is a dense selling pressure above 2,000, making it difficult to rise.
☠️ 10% chance: Breaking below 1,966, deep correction testing 1,900
Once the low is broken, the space below opens up. 1,900 is a psychological level and also a strong support recently; a drop to that level might see decent buying, but the process will be extremely painful.
💡 [Hardcore Operation Strategy] A must-see for survival
Decreasing volume and bearish trend + SuperTrend deep red + key support lost, under this combination, going long is like slow suicide.
🎯 Trend-following short position:
∙ BTC: Rebounding to around 66,800–67,144 shows signs of stagnation, enter short, stop loss above 67,400, target looking at 65,500
∙ ETH: Rebounding to around 2,000–2,027 shows resistance signals for shorting, stop loss above 2,050, target looking at 1,966
Wait for bottom signals before buying the dip: SuperTrend turning green again + synchronized volume increase, both are essential. Any rebound seen now is just providing short sellers with better entry points; don't mistake the rebound for a trend.
👉 Follow me for the most genuine trading logic and hardcore points every day! Like + share, refuse to be a retail investor!
⚠️ Content is for reference only and does not constitute investment advice. The market has risks; make independent decisions.\u003cc-72/\u003e

\u003cc-78/\u003e