Polkadot (DOT) price continues to extend the downward trend, dropping below the 1.40 USD threshold at the time of recording on Wednesday, after having slightly weakened in the previous session. This downward trend is reinforced by the weakening of derivative indicators, along with a series of increasingly negative technical signals, indicating an increasing risk of deeper correction for DOT in the short term.
Derivatives index weakens
Funding rate data from CoinGlass shows that pessimism is engulfing Polkadot. This index has reversed into negative territory since Saturday and continued to plunge to -0.019% on Wednesday, indicating that short sellers are willing to pay fees to maintain positions — a signal reflecting expectations that DOT prices will weaken in the short term.
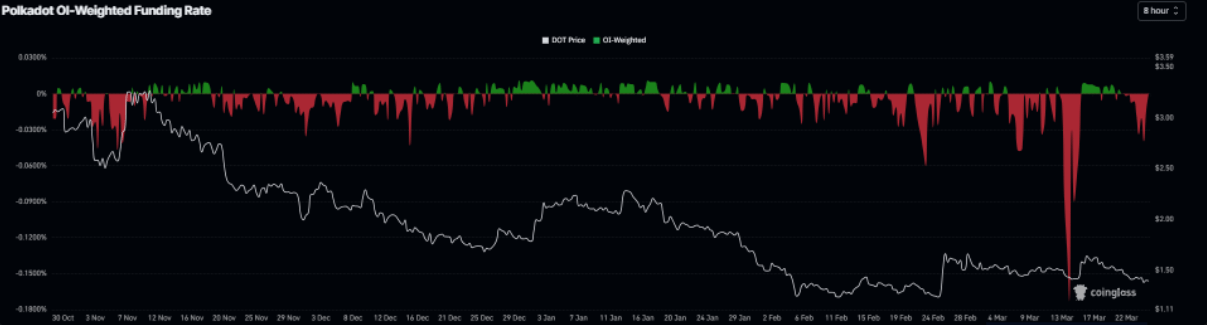 Polkadot funding rate chart | Source: Coinglass
Additionally, the DOT long/short ratio on CoinGlass currently stands at only 0.82, further reinforcing the downward trend as most traders are leaning towards the scenario of prices continuing to decline.
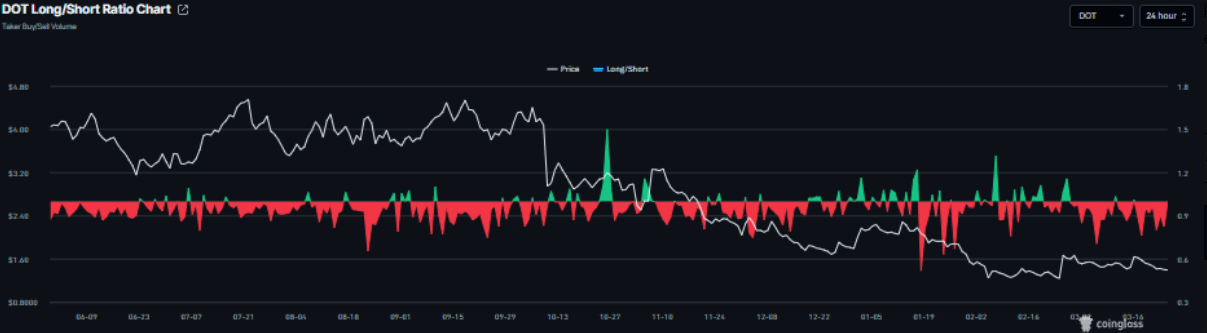 DOT long/short ratio chart | Source: Coinglass
Other negative signals
Santiment's Social Dominance index continues to reinforce the negative scenario. This measures the proportion of discussions about DOT on crypto media channels, and since mid-March, this index has been continuously declining, now at only 0.044%. This trend shows a noticeable weakening of interest and investor sentiment.
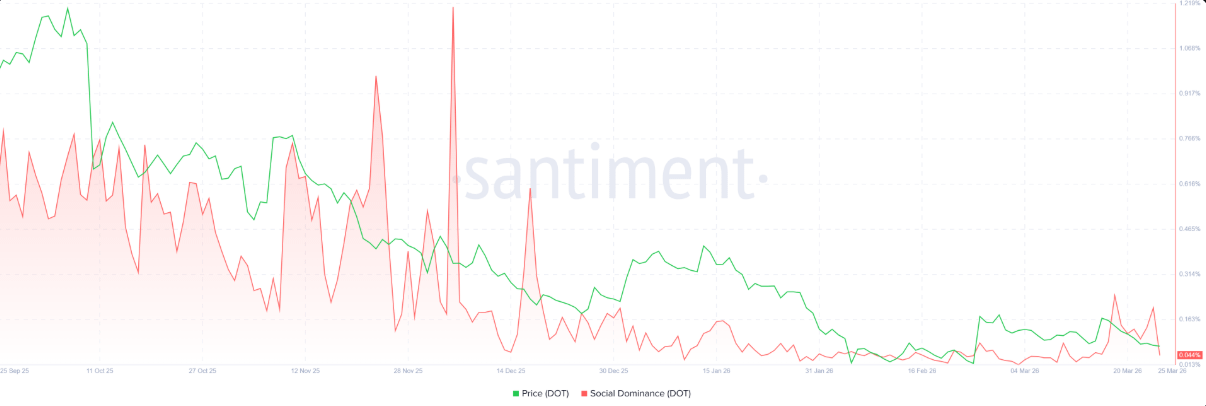 DOT social dominance chart | Source: Santiment
From an institutional perspective, demand remains weak. The first spot Polkadot ETF issued by 21Shares has not recorded additional capital flows since the initial investment of 544,490 USD on March 12, reflecting caution and a lack of enthusiasm from institutional investors.
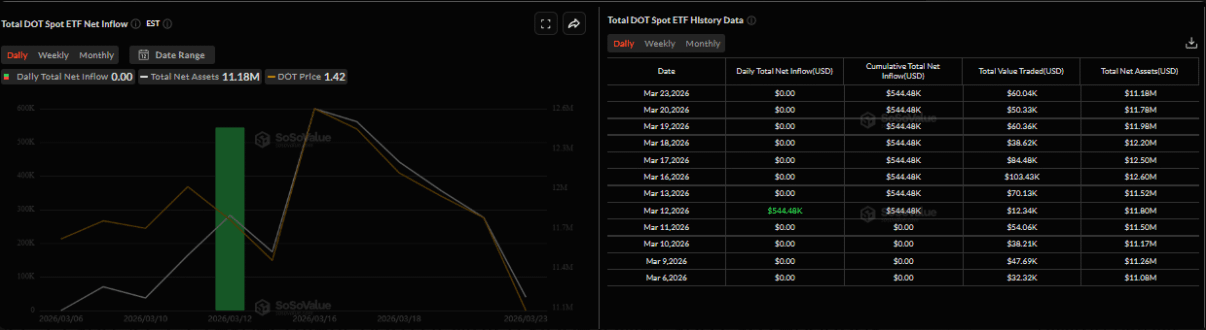 Total net capital flow into DOT spot ETF chart | Source: SoSoValue
Polkadot price forecast: Risk of deeper correction
DOT price continues to weaken and slide below the 1.40 USD mark on Wednesday, indicating that the short-term trend still leans towards decline. Selling pressure persists as the price remains below the 50-day and 100-day EMA lines (around 1.53 USD and 1.75 USD respectively), with both moving averages sloping down and acting as dynamic resistance.
Market momentum has not yet improved. The RSI index on the daily frame is at 42, below the neutral threshold of 50, reflecting that sellers are dominating. At the same time, the MACD has turned negative as the MACD line is below the signal line and the histogram maintains negative values, reinforcing the view that the upward momentum has weakened after being rejected at the nearest resistance zone.
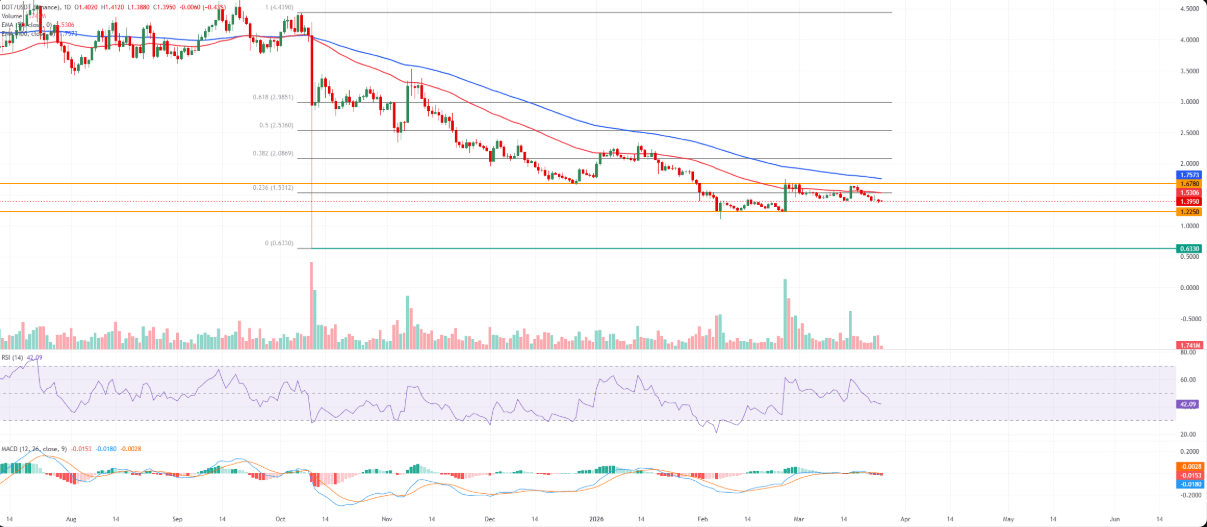 Daily DOT/USDT chart | Source: TradingView
Regarding technical levels, the nearest resistance is at 1.53 USD (50-day EMA), coinciding with the 23.6% Fibonacci retracement level of the decline from 4.43 USD to 0.63 USD, and is just below the horizontal resistance area at 1.67 USD. If the price can close the day above the 1.53 USD threshold, it is likely to extend the recovery towards 1.67 USD — an area with significant supply concentration.
On the contrary, the nearest support is identified at 1.22 USD. Breaking this level could pull the price back to the 1.00 USD area (a significant psychological level) before continuing to test deeper support around the 0.63 USD bottom according to Fibonacci. In the current context, with DOT still trading below 1.53 USD, recovery phases are likely to continue facing strong selling pressure at the resistance zone.
https://coinphoton.com/polkadot-doi-mat-rui-ro-giam-sau.html