#اخبار_الكريبتو_العاجلة #عملات_رقمية #اقتصاد_رقمي #WCT # @everyone #كريبتو #العملات_الرقمية #تداول #استثمار #بيتكوين #تعلم_التداول #دعم_ومقاومة #Zcrypto $XRP
Trump's stock is currently trading in the range of $3.30.
The value of the trading volume indicator indicates moderate selling pressure.
The price of Trump coin (TRUMP) is currently witnessing a phase of stability after a series of sharp corrections from its previous highs. For a potential reversal of the trend, a steady upward wave must form on the daily timeframe. In the meantime, its price has dropped by 10% over the past week, marking a decline.
At the time of writing this report, the price of TRUMP is trading within a range of $3.34, after increasing by 3.11% over the past 24 hours. Furthermore, the daily trading volume has decreased by 8.84%, reaching $145.36 million, according to CoinMarketCap.
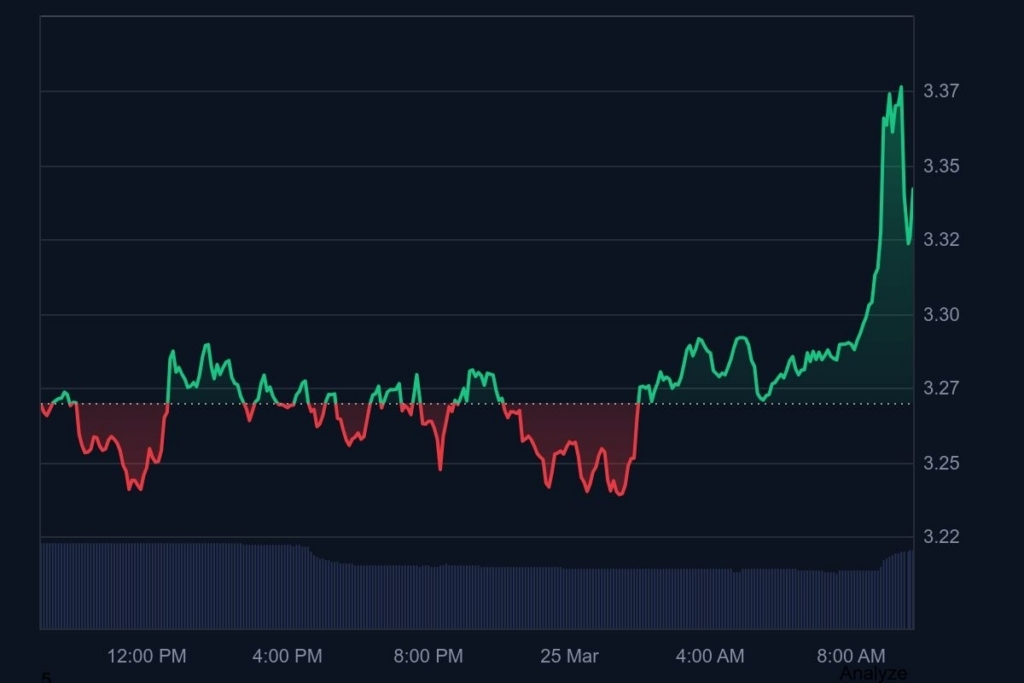
The downward shift in the trading chart could lead to a rebound in Trump's stock price towards the support level at $3.31. Further downward correction could create a 'dead cross' pattern, which would push the price further down, below $3.28.
If Trump's stock price begins to rise, it is likely to climb and test the resistance level at $3.37. With additional gains, the strength of buyers may increase and they may start forming a 'golden cross' pattern. This, in turn, will gradually raise the stock price above the $3.40 level.
What signals do Trump's indicators provide on the chart?
According to technical analysis, the Moving Average Convergence Divergence (MACD) indicator and signal lines are below the zero line, indicating that Trump's market is trending downward. The price movement is weak, and unless there is a change in momentum, this decline will continue.
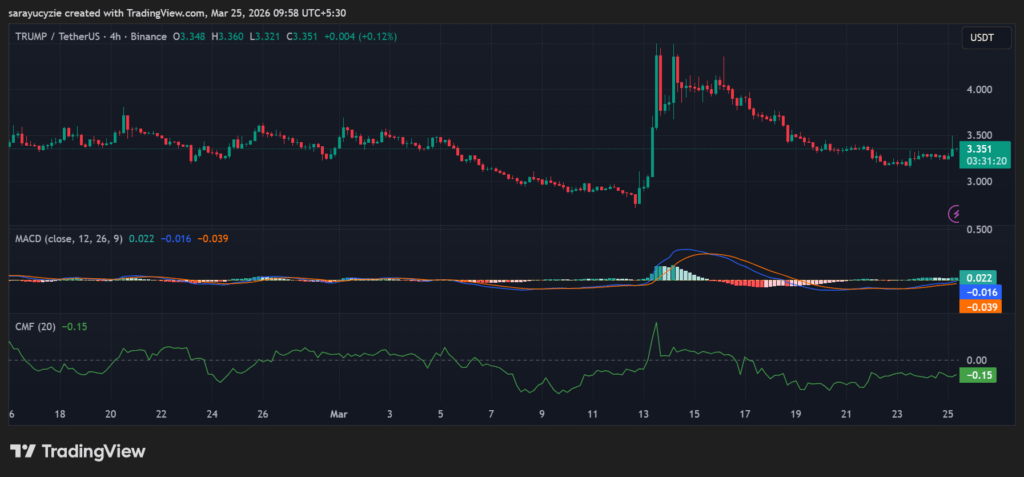
Additionally, Trump's Chaikin Money Flow (CMF), at -0.15, indicates moderate selling pressure. It is noteworthy that money is flowing out of the asset, and buying interest is weak, which may keep the price under pressure. The market trends downward unless buyers intervene and change the flow direction.
The daily Relative Strength Index (RSI) for Trump, at 56.44, shows a slight upward trend. The price is moving up, but it is not very strong. The market is also gradually trending upward, with enough room to continue rising if momentum increases.
The Bulls and Bears Power (BBP) indicator, at 0.133, indicates a slight edge for buyers. Buyers dominate the market, and Trump's market tends to rise gradually rather than move strongly. This suggests sideways movement unless momentum begins to increase.$BNB

