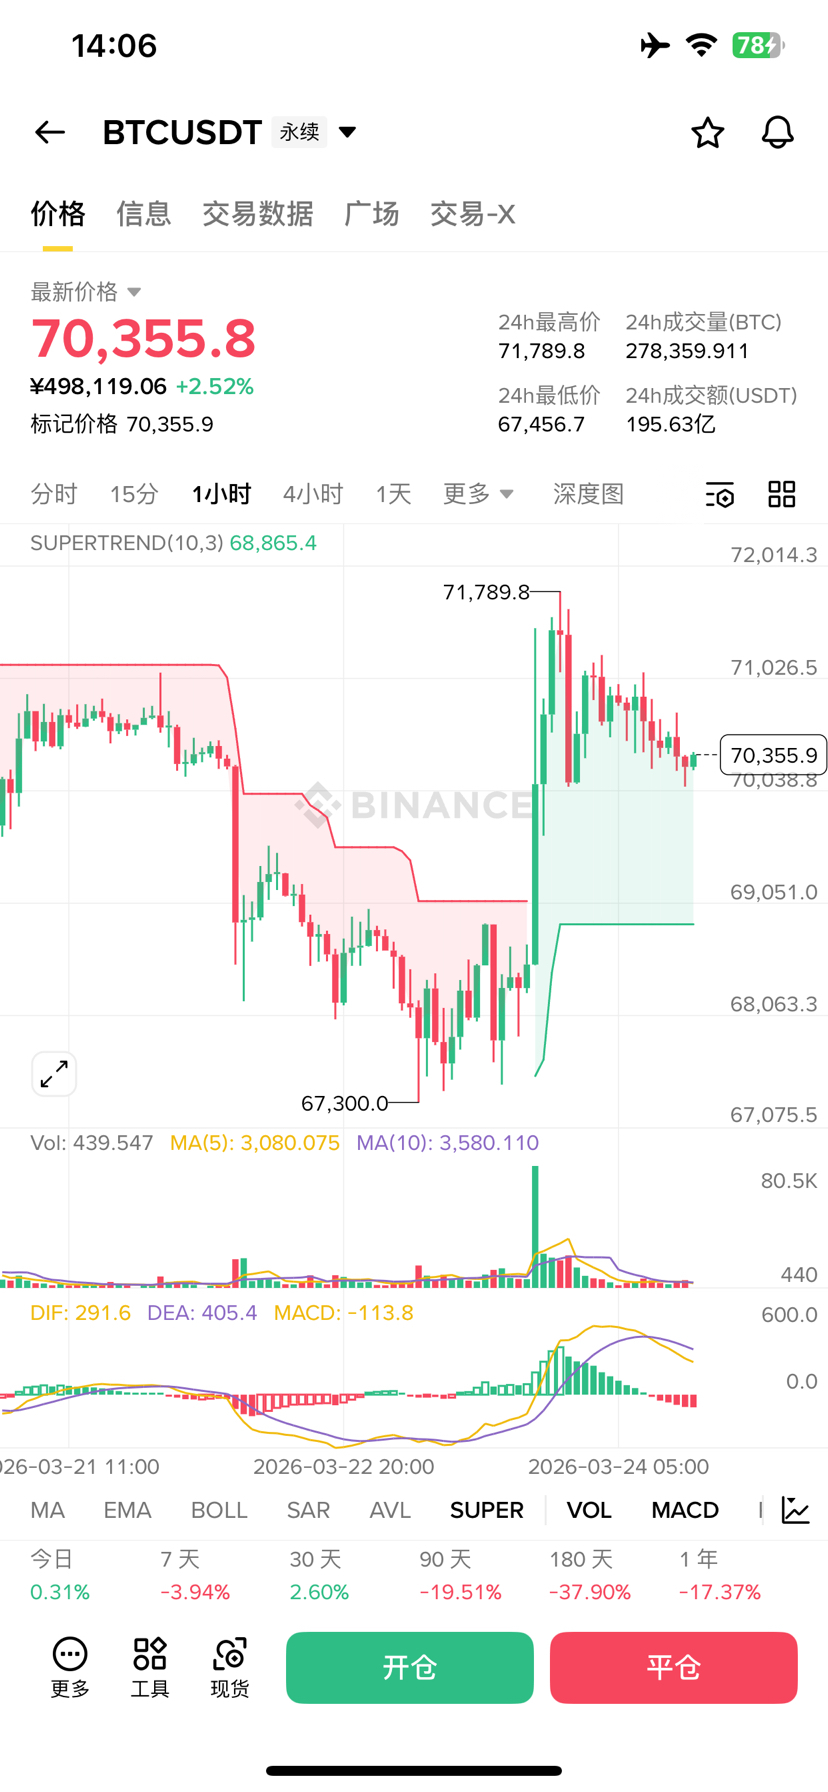
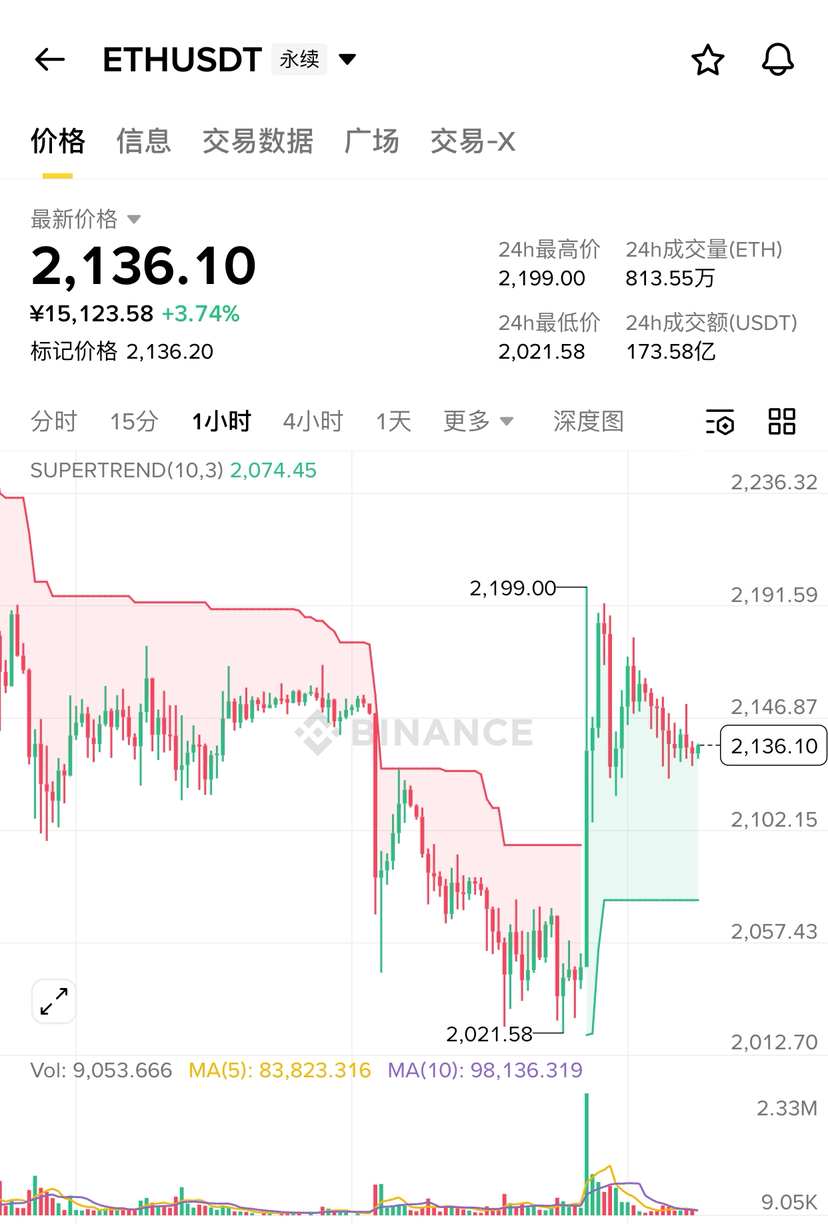
Bitcoin 70,355, Ethereum 2,136, today can be considered a report card. Bitcoin has bounced back from the low of 67,300, while Ethereum has risen from its lowest of 2,021 to the current price, with increases of 2.52% and 3.74% respectively. More importantly, the SuperTrend for both coins has turned green on the 1H chart—Bitcoin support is at 68,865, and Ethereum support is at 2,074, with the green channel reopening. However, celebrating too early is the most expensive lesson in this market; the current question is: is this green turn real, or just another false move?
The information in this chart is substantial. On the left, there is a large segment of red decline, dropping from a previous high all the way down to 67,300, with almost no decent rebound in between. The rise on the right is clearly different; the volume was released when breaking through, and that big bullish candle that surged up to 71,789 shows the largest volume during this entire period. This is not a case of low volume trickery; there is serious capital pushing it. SuperTrend successfully turned green, with support at 68,865, and the current price of 70,355 is nearly 1,500 above support. However, the MACD data is worth noting: DIF 291.6, DEA 405.4, MACD bar -113.8, DIF is still below DEA, and the golden cross has not yet formed; there is still a bit of momentum lacking. After surging to 71,789, it has retraced to the current 70,355, a pullback of nearly 1,400, and the volume has also shrunk from the peak to 439. Whether it can maintain support going forward is key.
Ethereum's movement is more decisive. From 2,021, a large bullish candle directly spikes to 2,199, an increase of 8.8%, with volume surging more significantly than Bitcoin— that spike in volume far exceeded all previous bars, indicating large funds concentrated their entry at that time. SuperTrend turns green, support at 2,074, current price at 2,136 is above the support by 60 dollars. However, after spiking to 2,199, it also quickly retraces. Now at 2,136, volume has shrunk to 9,053, MA5 is 83,823, MA10 is 98,136, and the volume is now less than one-tenth of the moving average, indicating that after large funds rushed in, retail investors did not follow, and the relay is insufficient.
The common feature of the two charts: the SuperTrend turning green is real, and the volume increasing during key breakthroughs is real, but the surge followed by a pullback and rapid volume shrinkage is also real. Now the bulls are regaining dominance, but whether they can hold steady still needs verification.
Probability of bulls and bears
BTC | Current price 70,355
🚀 Pullback at 68,865 support stabilizes, then attacking the previous high of 71,789 (40%)
The first pullback after the SuperTrend turns green is normal; as long as 68,865 holds, this is a standard bullish structure. If the pullback doesn't break, it is a buying point. If the volume expands again after contracting at a low level, the previous high of 71,789 will be the next target, and after breaking through, look at the range of 72,500–73,000.
⚖️ Oscillation and consolidation in the range of 70,000–71,500 (30%)
The MACD golden cross has not yet formed, and the momentum is lacking; in the short term, it may consolidate in this range to digest floating capital. Once the MACD golden cross is confirmed, the direction will be clearer, and this consolidation period is not the best time for operations.
📉 Volume can't keep up, pulling back to test 69,500 (20%)
After the surge, the volume quickly shrinks, and profit-taking emerges, with the price sliding back to near 69,500. As long as it doesn't break the SuperTrend support at 68,865, the bullish structure remains intact, and reaching that point may actually be a better buying opportunity.
☠️ Breaking below 68,865 declares the green reversal a failure (10%)
Breaking the support means this surge is another false breakout, and the lower point of 67,300 re-enters the field of vision. If this happens, one needs to run fast; do not hold on to the thought that 'it will come back.'
ETH | Current price 2,136
🚀 Hold the support at 2,074, aiming for the previous high of 2,199 (40%)
The volume for this surge in Ethereum is more intense than Bitcoin, indicating higher recognition from capital for Ethereum. If the SuperTrend support at 2,074 holds, the next step will be to challenge 2,199 again; once above that, look at the range of 2,210–2,250.
⚖️ Oscillation and accumulation in the range of 2,074–2,175 (30%)
The volume has quickly shrunk from its peak, requiring time to regroup. It's necessary to trade back and forth in this range until the volume returns before choosing a direction. The oscillation structure of Ethereum is healthier than Bitcoin, with the support at 2,074 being the bottom line during the consolidation.
📉 Pullback near 2,100 to test the support's holding capacity (20%)
The inability of the volume to keep up leads to a slight price pullback, testing whether the 2,100–2,074 range can provide support. This is near the SuperTrend support; if capital is defending it, it is a buying point; if no one is defending it, that is the problem.
☠️ Breaking below 2,074 ends the green reversal (10%)
The support has failed, and the previous bullish candle has turned into a false signal, with the low point of 2,021 facing a second test. This is the worst-case scenario, with the current probability being the lowest, but one should not let their guard down.
Operation:
This time the SuperTrend turning green is accompanied by a significant increase in volume, indicating higher quality than previous false green reversals. However, after the surge, the volume quickly shrinks, and the MACD golden cross has not yet been confirmed. Now is not the best time to chase long positions—the most cost-effective entry point is near the support, with Bitcoin looking at 68,865–69,500 and Ethereum at 2,074–2,100. Enter only when there are signs of stabilization, and set the stop-loss below the support.
Currently, short positions are not considered; going against the trend just after it turns green carries too high a risk unless the support is clearly broken.
Wait for a pullback, look for a buying point; this time it might be real.


#特朗普缓和局势 #美国暂缓攻击伊朗发电站 #金价连续第十天下跌 #币安人生 #CZ称比特币是硬资产