Geopolitical conflicts continue to escalate, and the real moment of panic may not have arrived yet. Here in the spot market, everyone should stay calm and not rush to take action. When it's time to accumulate at the bottom, I will remind everyone immediately.
Now is both the most challenging stage in history and a stage full of great opportunities; crises have always been a mix of danger and opportunity. Be patient and act like a top hunter — truly skilled hunters often disguise themselves as prey, quietly waiting for the best moment.
The core of trading lies in prioritizing logic and validating trends. Every fluctuation in the market hides opportunities for pre-arranged strategies. We insist on deriving direction from structure and determining entry and exit points based on key levels, not swayed by market sentiment. Our previous predictions once again align with market trends; we clearly pointed out that Bitcoin will continue its downward oscillation trend. Even if a rebound occurs, it must first test the crucial support level of 69500–69000. In the short term, we suggest gradually positioning short orders above 72000.
Although the ideal entry point was not provided today, the overall market completely aligns with our projections. In the evening, the price dipped to a low of 68750 to test support, and then rebounded back above 70000.
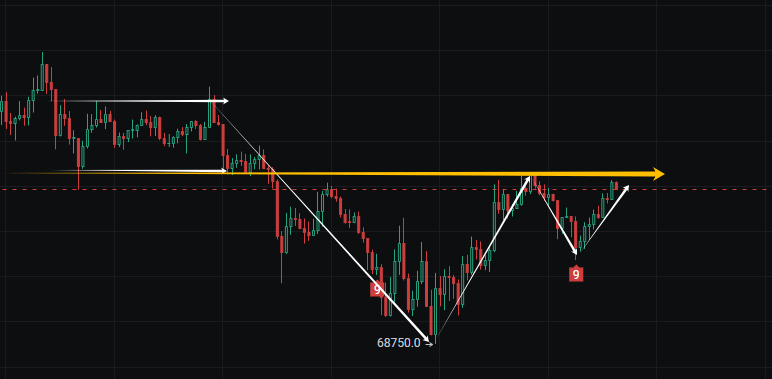
Returning to today's market, Bitcoin's price has seen significant pullbacks after two attempts to break previous highs, which is a very typical bearish market behavior. Each rally is actually to consume liquidity below, and once the chips are cleared, selling pressure immediately follows. After the last wave of new highs, there was a series of four consecutive bearish candles before the rebound; this time there are already three consecutive bearish candles. Will there be another four consecutive bearish candles before a rebound? Everyone can pay close attention. Although the overall structure is bearish, we are still in a bearish wedge consolidation range.
After the Bitcoin price returns to the range, the transition between long and short will be particularly quick, and it's easy to suddenly shift to a bullish candle after consecutive bearish candles. Moreover, this rapid decline in daily lines has left a price vacuum in the 72000-73000 area, and it's highly probable that this position will be filled later. As long as the price remains below 73000, the downward structure remains healthy, which also confirms what I said earlier: even if there is a rebound, it will only produce a lower high, giving us better short opportunities.
In the short term, the support area of 69500-69000 that we mentioned yesterday stabilized and rose multiple times near 69000, confirming the support effect. Although we are bearish in the overall direction, when to rebound and when to short are basically within expectations. It's just that this rebound failed to break through 70700, and the strength is not considered strong. If you want to do a rebound, I only look at one position: 68400-68000, where the previous bottom reversal point is, and it's also a key cost area for bulls.
Overall, the market continues to operate within the range, with key resistance above at 73000, and maintaining a bearish outlook below. Short-term support is effective but the rebound is weak, and it's highly probable that there will be another test of support before a rebound.
Want to keep up with structural judgment, key points, and wave ideas in real-time without stepping into the trap of false signals?
Welcome to join my study group.
Daily sharing in the group:
Technical structure explanation, key position analysis, position risk control, real-time idea reminders, various trading tips.
The market has risks; trading requires caution. The above content is only a personal idea sharing and does not constitute investment advice. Profit and loss from actions taken based on this are at your own risk.