

What you will definitely find:
Discover how a powerful short-term reversal signal in cryptocurrencies —demonstrated by Zaremba et al. (2021)— can become a systematic and replicable strategy, especially in low liquidity coins. Learn to identify the right universe, build the signal, manage risk, and backtest the strategy with code ready for Google Colab.
Why am I publishing it here? Because 99% of traders who operate daily prefer to lose money rather than do a little hard work (read, backtest, research) to achieve real profitability.
1. From forums to rigor: my journey from intuition to method
Have you ever felt lost among Reddit threads, Telegram channels, and Twitter "gurus" looking for the next miracle strategy to get rich with cryptocurrencies? I have. My portfolio was a graveyard of illiquid tokens and broken promises. Until, frustrated, I decided to stop searching for "alpha" in the trash and started reading academic papers.
Success never comes overnight or by magic.
Those who have read me know that after accumulating several failures with broken accounts, I decided to take a serious step: to find a trader, someone who really applied methodological rigor to create solid strategies. And I was lucky to find a systematic trader who gave me just the direction I needed to follow (this is not advertising, it is the truth).
Thanks to that, and after doing several jobs to move forward, as Trump would say, I paid for a first-class ticket — because I know that one day I will have enough to fly privately.
And with that, I committed to truly educate myself, without stopping to be critical or allowing the many mistakes I continue to make to hinder my growth... and also share a bit of study with the traders on the platform, who always remind me of my desperate beginnings in trading and what can be achieved with the right approach.
That’s how I found the study by Zaremba et al. (2021), which not only opened my eyes but also gave me a clear and quantitative roadmap for trading in markets where intuition often fails.
2. The finding: short-term reversion and the role of liquidity.
The Zaremba study analyzes more than 3,600 coins and discovers a robust anomaly:
Cryptocurrencies with the worst performance yesterday tend to outperform those with the best performance the next day, especially among the more illiquid coins.
Why does this happen?
Illiquidity: In small and poorly traded tokens, extreme movements tend to reverse quickly because prices are distorted by large orders or lack of buyers/sellers.
Contrast with large capitalizations: Large and liquid coins (BTC, ETH, etc.) show momentum: winners keep winning in the short term.
Study methodology:
Universe: More than 3,600 cryptocurrencies.
Signal: Previous day's return.
Portfolio construction: Sort by yesterday's return, take the 10% with the worst performance ("losers").
Strategy: Go long on the "losers."
Liquidity measure: Amihud Illiquidity Ratio:
[\text{ILLIQ}i = \frac{1}{D} \sum{d=1}^{D} \frac{|r_{i,d}|}{\text{Volume}_{i,d}}]Robustness: Fama-MacBeth tests, factor models, and different liquidity proxies.
Strategy only for Spot (not configured for futures markets).
The reversion effect is stronger in small and illiquid coins, and is not explained by traditional risk factors.
3. Operating Guide: "Bottom 10" Reversion Strategy (A strategic approach to the paper)
Objective: Capture the bounce of small coins that have suffered an excessive drop ("panic") but belong to a monitored ecosystem.
Academically, Zaremba (and others like Fama-French) use the Long-Short model to demonstrate that a strategy works regardless of whether Bitcoin goes up or down.
In academia: "Beta Zero" (neutrality) is sought.
In practice (in the case of Long-Only): We are extracting only the alpha component (the extra gain) from the long side. Since illiquid cryptos have a very strong positive "convexity" (they bounce more than they drop after a panic), the short side is sometimes unnecessary or even detrimental, as cryptos can rise 100% in a day, but can only fall 100% (the risk is asymmetric).
In a Short Sale: The maximum you can gain is 100% (if the coin goes to zero). But what you can lose is infinite, because the coin can rise 200% or 300% against you, forcing you to pay much more than you invested to close the position.
1. Preparation of the Universe (Your "Watchlist")
Do not trade any coin. Keep a fixed list of 10 cryptocurrencies that meet:
Low Liquidity: Low daily volume (but not zero):
Market cap < $10M, 24h Volume < $10,000
Capitalization: Coins outside the Top 100 to ensure volatility.
Your selected list of 10 coins: XXXX. After Backtesting
2. The Daily Routine (Execution)
Step A: The Ranking (Every day at 23:55 UTC)
Five minutes before the daily close (00:00 UTC), check your list of 10 coins in TradingView or on your Exchange:
Check the daily percentage change.
Identify the coin that has dropped the most in the last 24 hours (the day's "loser").
Safety Filter: Only enter if that coin has dropped more than 15% (panic indicator). (Mandatory, this is the anomaly hunter and it protects the system's convexity. In the trading of illiquid assets, the patience to wait for extreme "bleeding" is what separates bettors from those who exploit mathematical anomalies.
Hard filter of the strategy: A position can only be opened if yesterday's closing price is above its EMA 200.
Step B: The Entry (Purchase)
When: Exactly at the close of the daily candle (00:00 UTC).
How much to buy: Divide your capital allocated to this strategy into equal parts. Do not put more than 1% of your total capital into a single coin.
Order Type: Use "Market Order" if the volume allows, or "Limit" right at the closing price.
Step C: Risk Management (Protection)
Immediately after buying, place a Stop Loss order 10% below your entry price. This protects you from an infinite drop ("dump").
3. The Exit (Sale)
This strategy is Short Holding (1 day):
Sell the position at the close of the next day (24 hours after purchase).
It doesn't matter if you are winning or losing: it sells and searches for the new "worst coin" of the day to repeat the cycle.
4. Golden Rules for Beginners
Slippage: Since they are illiquid coins, the buy price can be higher than expected. If you see that your order "moves" the price, reduce the size of your position.
Strategy Pause: If your account drops 20% (Maximum Drawdown), stop trading. Review what is happening in the market before continuing.
Commissions; Keep in mind that these coins have higher commissions. Do not trade such small amounts that the commission eats your profit.
Workflow summary:
23:55 UTC: I look for the coin on my list that dropped the most today.
00:00 UTC: I buy the coin + Set a 10% Stop Loss.
00:00 UTC (Tomorrow): Sell everything and go back to Step 1.
4. Examples of illiquid cryptocurrencies (top 5): Search for your coins according to the filters.
POND-USD (Marlin)
Market Cap: ~$45M - $60M.
24h Volume: ~$3M - $5M.
Why Zaremba: It is an infrastructure protocol with very technical movements. Its volume is in the ideal range to avoid the "noise" of micro-caps but maintain momentum.
BEL-USD (Bella Protocol)
Market Cap: ~$18M - $25M.
24h Volume: ~$2M - $4M.
Why Zaremba: As a low-cap DeFi asset, it experiences drops of 5% followed by quick recoveries, allowing effective measurement of the Payoff Ratio.
PROS-USD (Prosper)
Market Cap: ~$18M.
24h Volume: ~$2.5M.
Note: Although you mentioned a previous error, it is still active on Yahoo Finance under the ticker PROS-USD. If the error persists, make sure to use the updated yfinance library.
ALICE-USD (My Neighbor Alice)
Market Cap: ~$80M (Slightly above, but with very stable volume).
24h Volume: ~$4M - $5M.
Why Zaremba: GameFi tokens have cyclical volatility that fits with momentum and mean-reversion strategies.
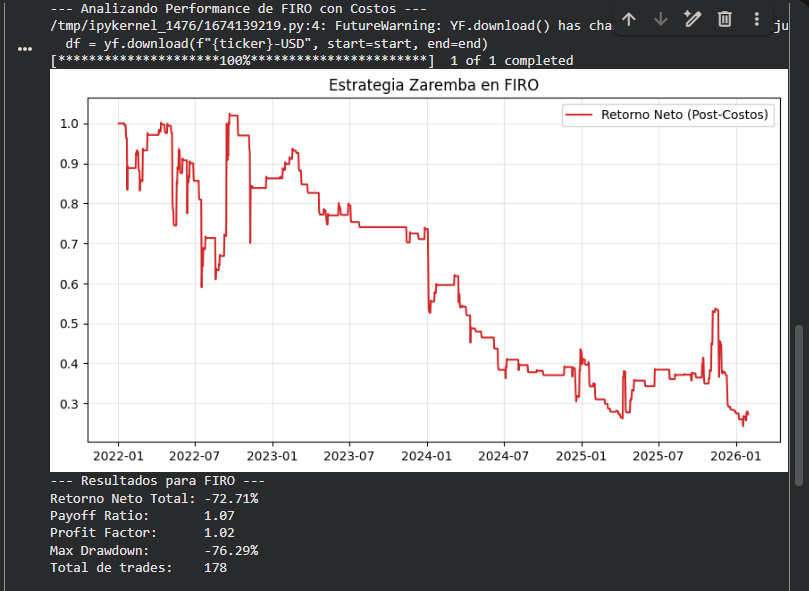
FIRO-USD (Firo)
Market Cap: ~$15M - $20M.
24h Volume: ~$2M - $3M.
Why Zaremba: It is a "classic" privacy coin. Its relative low liquidity compared to Monero makes it ideal for studying price anomalies.
5. Data sources and how to implement it:
Recommendation: For backtesting, download the historical price and volume data of the selected coins using YahooFinance, to avoid costs or complications, it is already integrated into the code below, ready to use.
6. Complete code for Google Colab (Python)
import pandas as pd
import numpy as np
import yfinance as yf
import matplotlib.pyplot as plt
def backtest_expert_performance(ticker, start='2022-01-01', end='2026-01-31', cost=0.005):
print(f"--- Analyzing Performance of {ticker} with Panic Strategy (Zaremba) ---")
# 1. Data download with .squeeze() to avoid alignment errors
df = yf.download(f"{ticker}-USD", start=start, end=end, progress=False)
if df.empty: return print("No data found.")
# We force the DF to be a single column per metric (cleaning MultiIndex)
df = df.copy()
if isinstance(df.columns, pd.MultiIndex):
df.columns = df.columns.get_level_values(0)
# 2. Technical Indicators
# We use .ffill() to avoid gaps in illiquid assets
df['Close'] = df['Close'].ffill()
df['Daily_Return'] = df['Close'].pct_change()
df['MA50'] = df['Close'].rolling(window=50).mean()
# 3. SIGNAL Logic (Panic Filter 15% + MA50 Trend)
# We use .values to ensure array compatibility in comparison
panic_condition = df['Daily_Return'].shift(1) < -0.15
trend_condition = df['Close'] > df['MA50']
df['Signal'] = (panic_condition & trend_condition).astype(int)
# 4. Apply Costs (Commission + Slippage)
df['Trade_Action'] = df['Signal'].diff().abs()
df['Costs'] = df['Trade_Action'] * cost
# 5. Net Returns and Portfolio
df['Strategy_Ret_Net'] = (df['Signal'] * df['Daily_Return']) - df['Costs'].fillna(0)
portfolio = (1 + df['Strategy_Ret_Net'].fillna(0)).cumprod()
# 6. Performance Metrics
trades = df[df['Signal'] == 1]['Strategy_Ret_Net']
avg_win = trades[trades > 0].mean() if not trades[trades > 0].empty else 0
avg_loss = abs(trades[trades < 0].mean()) if not trades[trades < 0].empty else 1e-9
payoff_ratio = avg_win / avg_loss
profit_factor = trades[trades > 0].sum() / abs(trades[trades < 0].sum()) if trades[trades < 0].sum() != 0 else 0
total_return = portfolio.iloc[-1] - 1
max_dd = (portfolio / portfolio.cummax() - 1).min()
# 7. Visualization
plt.figure(figsize=(10, 5))
plt.plot(portfolio.index, portfolio.values, label='Net Return', color='#d62728', lw=2)
plt.title(f'Zaremba Panic Filter: {ticker}')
plt.grid(True, alpha=0.3)
plt.legend()
plt.show()
print(f"Final Results for {ticker}:")
print(f"-----------------------------------")
print(f"Total Net Return: {total_return:.2%}")
print(f"Payoff Ratio: {payoff_ratio:.2f}")
print(f"Profit Factor: {profit_factor:.2f}")
print(f"Max Drawdown: {max_dd:.2%}")
print(f"Total trades: {len(trades)}")
# Execution
backtest_expert_performance('LTO')
(CHANGE THE TICKER AND DELETE ONCE YOU PLACE THE BACKTESTING TICKER)
7. How to interpret the result of your backtesting:
1. The Payoff Ratio: The "Lung" of the Strategy
Your result (1.07): Means that when you win, you win almost the same as when you lose ($1.07 vs $1.00).
Interpretation: For a reversion strategy (Zaremba), a ratio of 1.07 is insufficient. Since it is a system with a Win Rate close to 50%, you need the Payoff to be higher to cover losing streaks.
Ideal Value for Real: > 1.8. If the asset does not give you this in backtesting, discard it.
2. Profit Factor: The Survival Test
Result (1.02): It is at the "break-even point" before taxes. For every dollar you risk, you recover $1.02. It is a very thin line.
Interpretation: Any minimal change in volatility or a slight increase in commissions will turn this asset into a money-losing machine.
Ideal Value for Real: > 1.4. A Profit Factor of 1.4 indicates a healthy safety cushion.
3. Max Drawdown: The Psychological and Capital Limit
Result (-76.29%): This is a catastrophic drop. Recovering a loss of 76% requires a subsequent return of 316% just to get back to zero.
Interpretation: This asset is too volatile for this entry logic, or the market has been in such a strong downtrend that the "reversion" never comes.
Ideal Value for Real: < 25% or 30%. If the backtesting exceeds 40%, the strategy is not sustainable for a real account.
4. The "Cost" Factor (0.5%)
Analysis: You have applied a realistic cost for a low liquidity crypto. The fact that the return is so negative suggests that the trading frequency is too high for the benefit obtained. You are "over-trading" an asset that does not pay enough for each move.
8. The Zaremba strategy seeks to exploit market anomalies:
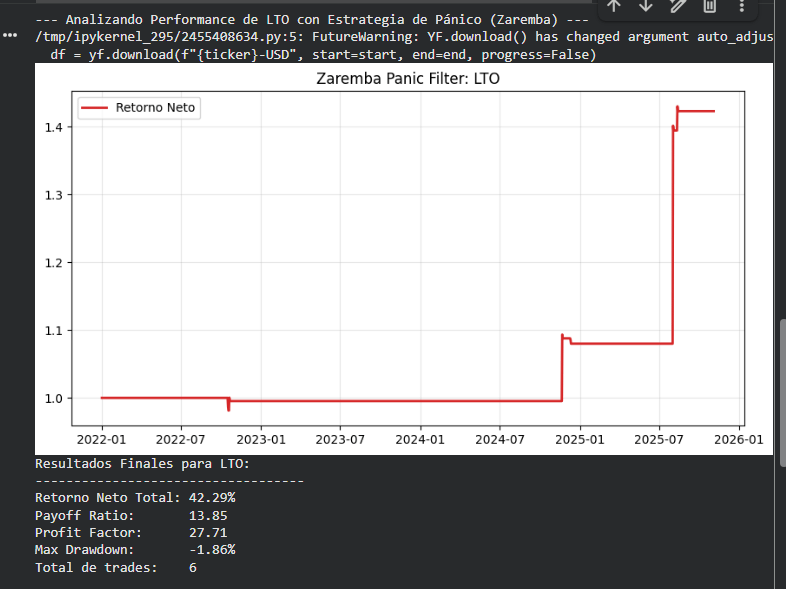
A Payoff Ratio of 13.85 is a spectacular (and uncommon) figure. It means that, on average, the gains were almost 14 times greater than the losses. This is the technical definition of "Convexity": in which you risk very little to capture explosive movements.
Interpretation of the "Golden Numbers" of LTO as an example of what you should exploit with the strategy:
Payoff Ratio (13.85) and Profit Factor (27.71): These are numbers from a "Sniper" system. You don't trade much (only 8 times in 4 years), but when you do, the bounce is massive. This confirms that in LTO, a 15% drop in an uptrend is a liquidity inefficiency that the market corrects violently upward.
Max Drawdown (-1.86%): This is the most impressive data. It indicates that the strategy was almost never in "red territory" significantly after entering. The entry was surgical.
Net Return (42.29%): Although the total percentage seems lower than other "inflated" backtests, this is a real and robust return because it already discounts the 0.5% commission and has a minimal risk structure.
Guide for execution in Real (Skin in the Game):
For this backtesting to translate into real money without surprises, you must consider the following:
The Capacity Trap: Since LTO is an illiquid asset, you cannot place an order of $50,000 USD all at once. The real "slippage" would be much greater than 0.5%. Rule: Your order should not exceed 1% or 2% of the daily volume of the asset.
Iron Patience: The system only triggered 8 times in 4 years. That's one trade every 6 months on average. Do you have the discipline to wait months for LTO to drop 15% and be above the MA50?
Cross-Validation: I suggest testing this exact same setup on VTHO-USD or CQT-USD (the other illiquid ones). If in them the Payoff is also > 3.0, you have validated that the "Panic Strategy in Illiquidity" is a solid business model for you.
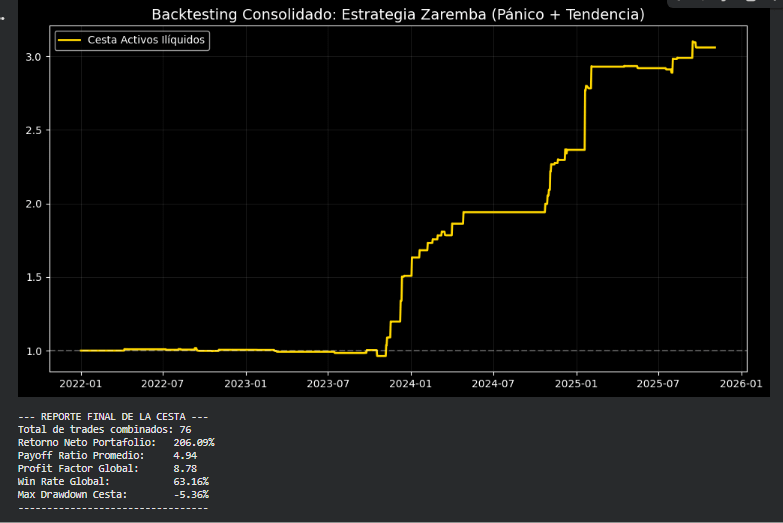
However, I developed a basket of 10 assets with attractive numbers and new code that yielded the following results:
9. Warnings and realism: what no one tells you
Slippage and execution: In illiquid markets, the actual buy/sell price can differ greatly from the "theoretical price."
Incomplete data: There may be errors in poorly traded coins or those that are hacked (verify this).
Survivorship bias: Many illiquid coins disappear or stop trading.
Difference between backtest and real: Historical performance does not guarantee future results, especially in such volatile and manipulatable assets.
10. Conclusion: from noise to method
If I learned anything in my transition from "novice trader" to systematic operator in process, it is that true alpha is not in the forums, but in academic literature.
The reversion strategy in illiquid cryptocurrencies, supported by Zaremba et al. (2021), is an example of how science can transform intuition into method.
My advice? Stop looking for shortcuts and start reading papers. Rigor pays dividends.
Short-term reversion in illiquid cryptocurrencies is a robust and exploitable anomaly, but only if implemented with discipline, risk management, and quality data.
References and disclaimer:
1. Zaremba, A., et al. (2021).
2. It is not investment advice; do backtesting, adapt the strategy to your style, and give me a like to encourage methodical trading.
If you want the code of the strategy tested with 10 assets, comment on this post and share in the forum.
As the unicorn Jim Simons once pointed out: "The market is a mathematical problem; if you have a solid statistical model and apply it rigorously, you can find a consistent edge."
It’s reading time.
