#اخبار_الكريبتو_العاجلة #عملات_رقمية #اقتصاد_رقمي #كريبتو #استثمار_رقمي #عملة_SXT #ارباح_الكريبتو #WCT # $AMZNon
The price of Chainlink (LINK) is currently fluctuating below its 50-day and 200-day moving averages, indicating limited momentum in the short term.
The immediate support level is near $8.80 to $8.20, while resistance levels are at $10 and the 50-day moving average.
With the rise of the cryptocurrency market today, supported by strong selling pressure and a resumption of institutional investment flows, Chainlink (LINK) has shown a slight increase, trading at around $9.24, with a daily low of $9.08 and a high of $9.54.
While short-term volatility continues to attract attention, LINK maintains its position above the major monthly low ranging between $7 and $7.3. Historically, strong accumulation and significant buying interest have been observed in this area in the long term. It now represents an important structural level, separating broader downside risks from the potential for sustainable recovery if it continues.
Major alternative currencies have followed Bitcoin's lead, recording notable gains as general market sentiment shifts away from extreme fear. At the time of writing this report, the price of LINK is $9.25, with a market cap of $6.5 billion. However, the price performance of the currency still reflects consolidation below the major moving averages.
Technical Analysis: The price of LINK is fluctuating below the major moving averages.
On the daily timeframe, the price of Chainlink remains below its 50-day moving average near $10.63, and below its 200-day moving average around $16.21, with the downward crosses of the averages continuing. Both moving averages are trending downward, a pattern typically associated with ongoing bearish pressure. The 50-day moving average currently acts as near-term resistance.
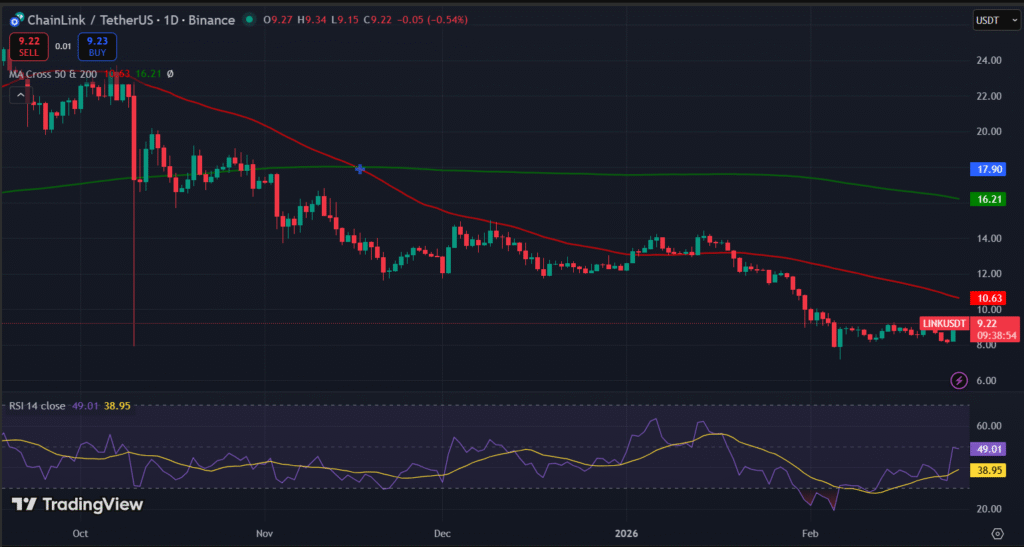
The Relative Strength Index (RSI) on the daily chart shows relative stability at around level 49, after bouncing back from the oversold area earlier. This indicates a decrease in recent selling pressure, but upward momentum has not significantly strengthened yet.
And when zooming in, the MACD indicator remains close to the zero line, without any confirmed bullish crossover. This indicates limited directional momentum in both directions currently.
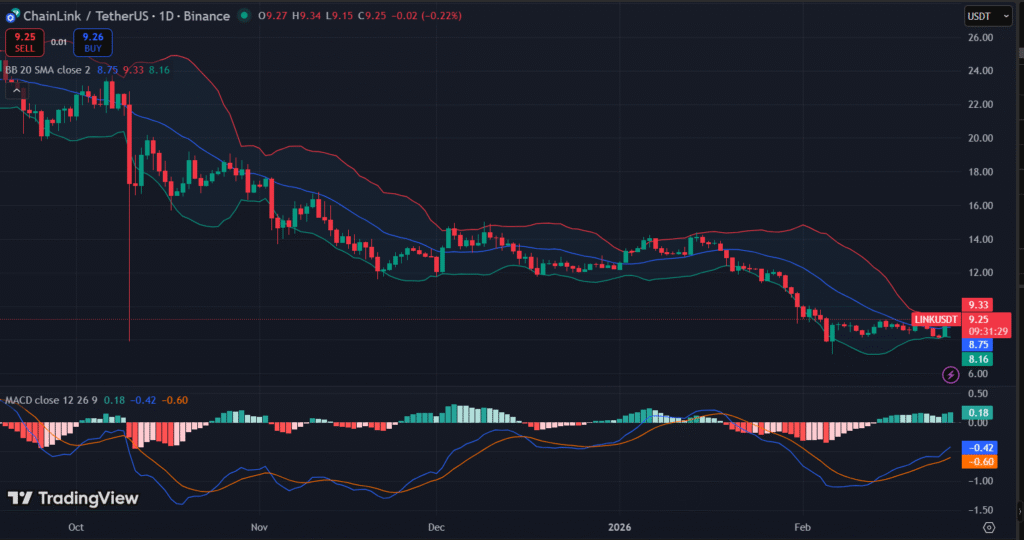
At the same time, the Bollinger Band indicators show an average widening, and the price is trading near the lower boundary, reflecting the recent consolidation and decline in volatility. A convergence of the price with the lower boundary usually indicates that the market is confined within a defined range, not a signal of a breakout.
If the price of LINK continues to fluctuate, immediate support levels are near the range of $8.80-$8.20, with additional support below these levels if selling pressure intensifies. If momentum increases, the near-term resistance level is at $10.00, with the 50-day moving average considered a key technical barrier. Overall, the performance of Chainlink's price indicates continued consolidation in the short term.$GOOGLon