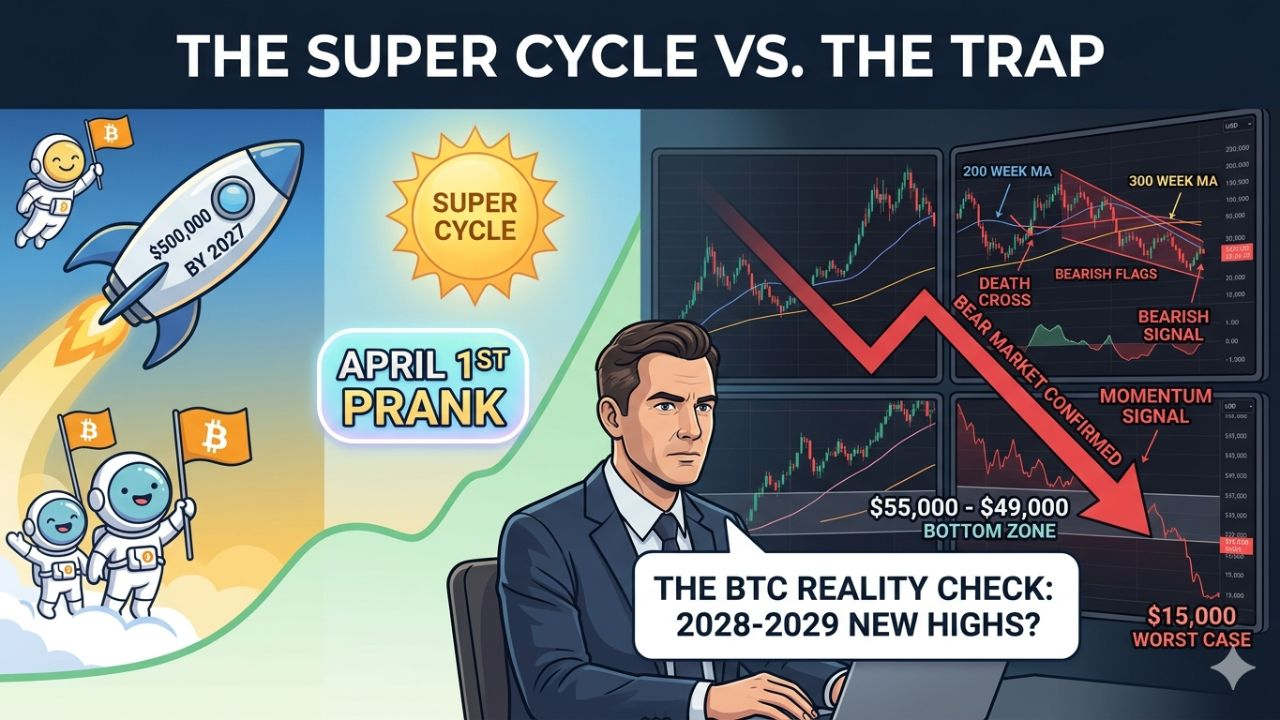
In the volatile world of cryptocurrency, the line between a "moon mission" and a "market crash" can often feel paper-thin. On April 1, 2026, the Doctor of Pump & Dump provided a jarring reminder of this reality, starting his update with a wild prediction: Bitcoin to $500,000 by 2027.
But as the date suggests, there was a catch. After a few minutes of fueling "moonboy" fantasies, the tone shifted drastically. Here is the breakdown of what is actually happening in the Bitcoin market according to the latest technical analysis.
The April Fools’ Prank That Hit Too Close to Home
The video began with an "urgent update" claiming the bear market was officially over, citing a minor 3.98% weekly rally as proof that a $500,000 "super cycle" had begun. The prank poked fun at common "perma-bull" tropes—claiming the four-year cycle is dead and that a massive short squeeze is imminent.
However, at, the creator revealed the joke, pivotting back to a sobering technical reality: The bear market is still very much intact.
The Bearish Thesis: Why $500k Isn't Coming (Yet)
Contrary to the opening prank, the actual analysis suggests that Bitcoin is currently trapped in a structural downtrend. Key takeaways from the technical charts include:
Cycle Persistence: The traditional four-year cycle remains the dominant force. The analyst expects the bear market to last at least until October.
The "Bull Trap" vs. "Bear Trap": While many hope the recent dip is a bear trap, the video argues we actually saw a bull trap at the top, followed by a confirmed change in structure across daily, weekly, and monthly timeframes.
New Highs: Don't expect a new All-Time High (ATH) anytime soon. The projection suggests Bitcoin may not see new peaks until 2028 or 2029.
Critical Price Levels to Watch
If you are looking for a place to buy or exit, the video highlights several "gravity wells" where Bitcoin is likely headed:
The Immediate Target: A move toward the 200 and 300-week moving averages, specifically looking for a bottom to develop between $49,000 and $55,000.
The Worst-Case Scenario: If a serious recession or banking crisis hits, Bitcoin could drop as much as 80-90% from its peak, potentially testing the $15,000 to $25,000 range.
The "Dead Cat Bounce": A deceptive "bear market rally" is expected after the initial crash concludes, which may trick investors into thinking the bull market has returned before the final "bottom falls out".
Strategy: Trading the "Main Movement"
The core advice for blog readers and investors is discipline. The analyst emphasized that "big money" isn't made by chasing 20% counter-trend rallies, but by playing the main movement.
Current indicators—like the Death Cross on the 4-hour chart and the failure to break the 50-period moving average—suggest that the path of least resistance remains down. The goal for savvy traders right now isn't to "buy every dip," but to wait for the "dip that ends the dipping".
Final Word
In a market fueled by "hopium," it's easy to get caught up in the $500,000 dreams. But as this April 1st update reminds us, the charts don't care about holidays or hype. Manage your risk, take profits when targets are hit, and remember: it’s still a bad day to be a perma-bull.