The charts are starting to look eerily familiar, and if you’ve been trading these markets for a while, you’ll know that history doesn't always repeat, but it often rhymes. The more I zoom out and study the current price action, the more I see a pattern playing out that we’ve seen before.
The Daily Candle Signal
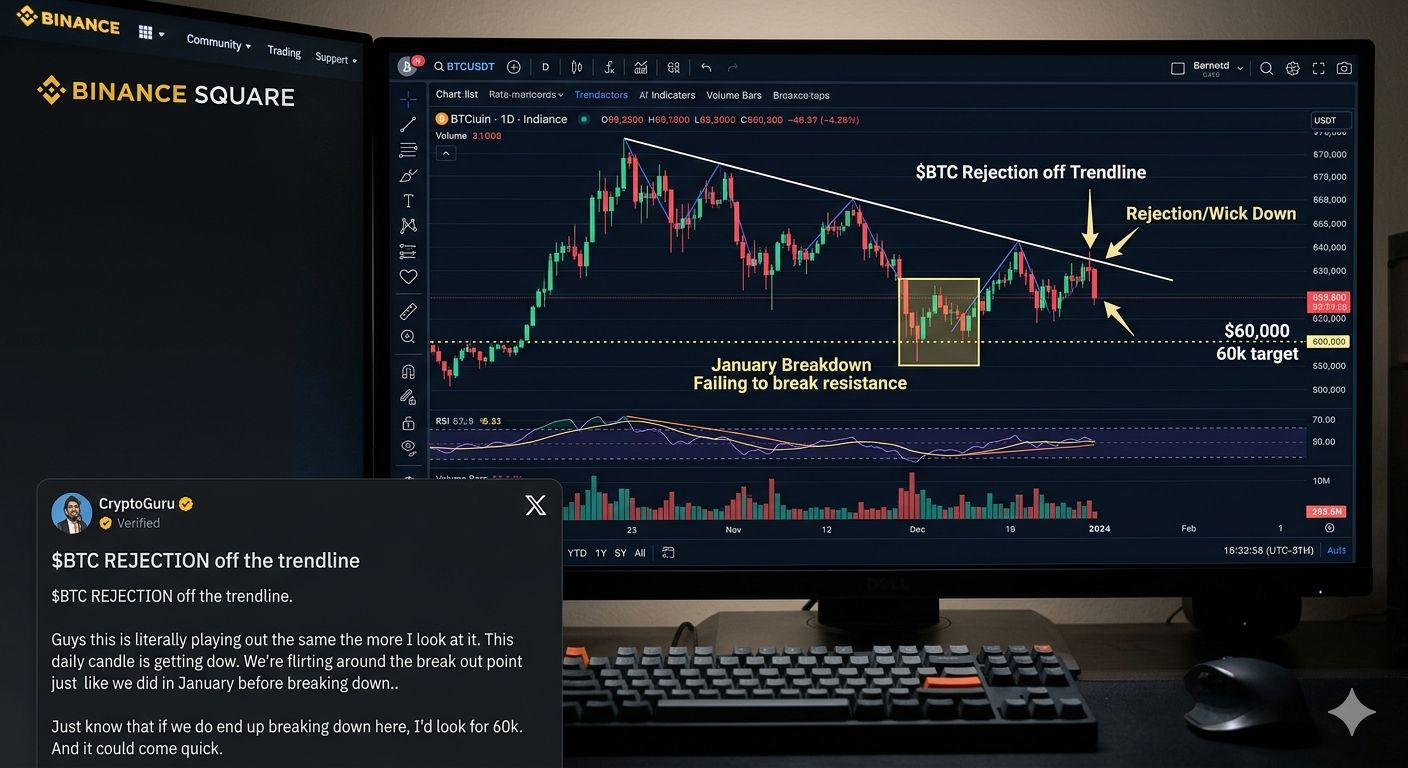
Currently, the daily candle is getting wicked down right at a critical resistance level. We are seeing a clear rejection off the trendline, suggesting that the bulls are struggling to maintain momentum at these higher elevations.
Flashbacks to January
We are currently "flirting" with the breakout point. This price action is almost identical to what we witnessed in January. We saw similar hesitation and hovering around key levels before the eventual breakdown occurred.
Key Levels to Watch
If the support fails to hold and we see a confirmed breakdown from this trendline, my eyes are on the downside targets.
Primary Target: $60,000

Velocity: High. If this move happens, expect it to be fast and aggressive.
Personal Strategy: I’m staying cautious here. Risk management is the name of the game when we are at such a pivotal "make or break" point. Don't get caught off guard if the floor drops—be prepared for a quick move toward the $60k zone.
What do you guys think? Are we heading for a correction, or is this just a fake-out before the real moon mission? Let me know in the comments!
#bitcoin #btc70k #CryptoAnalysis" #TechnicalAnalysiss #TradingSignals2026