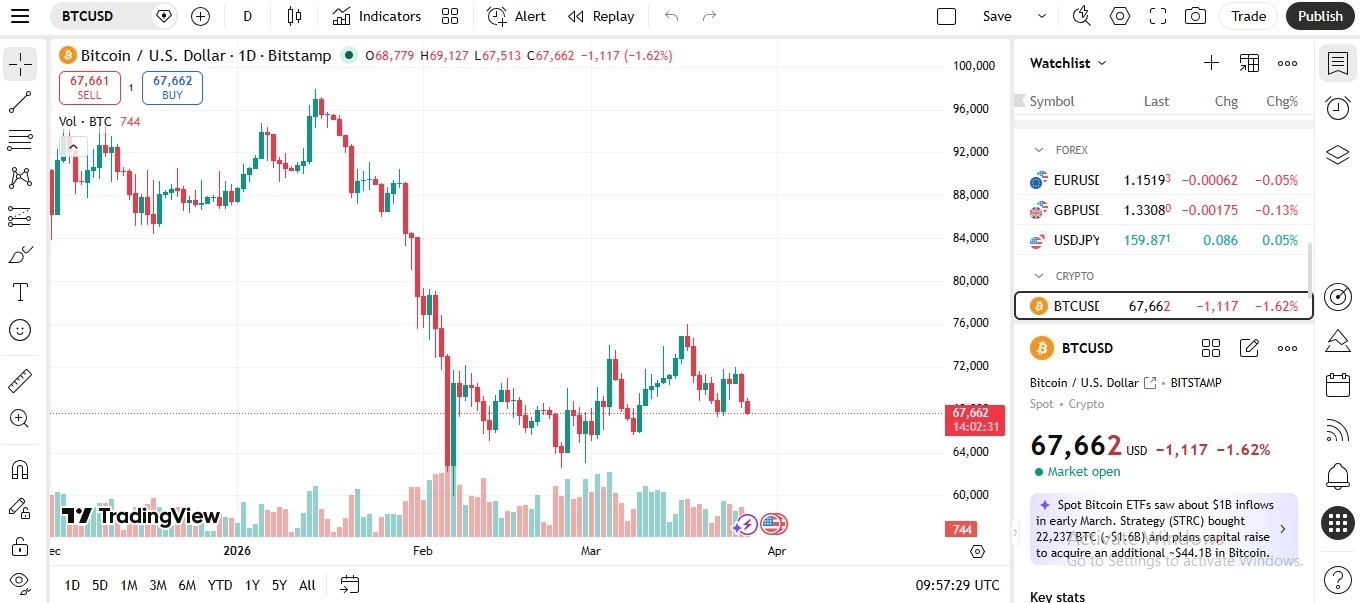
The Bitcoin daily chart (BTC/USD) shows a clear bearish trend followed by a period of consolidation. After reaching a high near the 90,000–95,000 range, the price experienced a sharp decline in early February, indicating strong selling pressure and a shift in market sentiment. This drop was accompanied by high trading volume, confirming the strength of the downtrend. Currently, Bitcoin is trading around 67,600 USD, with smaller candlesticks forming, which suggests reduced volatility compared to the previous sharp move.
In recent weeks, the price has been moving sideways between approximately 64,000 and 72,000 USD, forming a consolidation zone. This indicates that buyers and sellers are in balance, waiting for a breakout. If Bitcoin breaks above the resistance level near 72,000 USD, it may signal a bullish continuation. However, if it falls below the support around 64,000 USD, further downside could be expected. Traders should watch key levels and volume closely, as the next move will likely define the short-term end$BTC
Follow for more information!!✌🏼