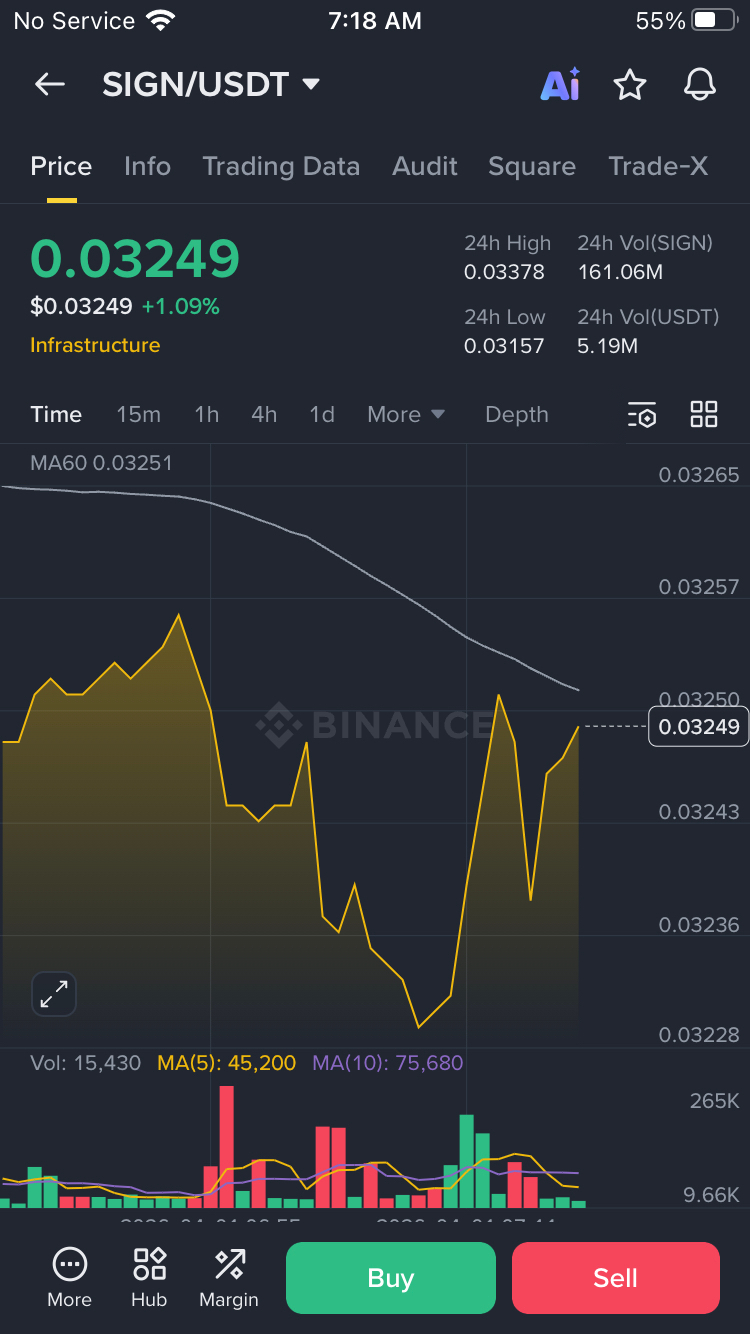
$SIGN is showing signs of life after a week of consolidation. The price is currently testing the 50-day EMA, which has acted as dynamic resistance since the last downtrend.
📊 Chart Analysis
· Support: $0.0395 (previous range low)
· Resistance: $0.0440 (neckline of the accumulation zone)
We are seeing a bullish divergence on the 4-hour RSI—momentum is building even as price action remains relatively calm. Volume is starting to trickle in ahead of the European session.
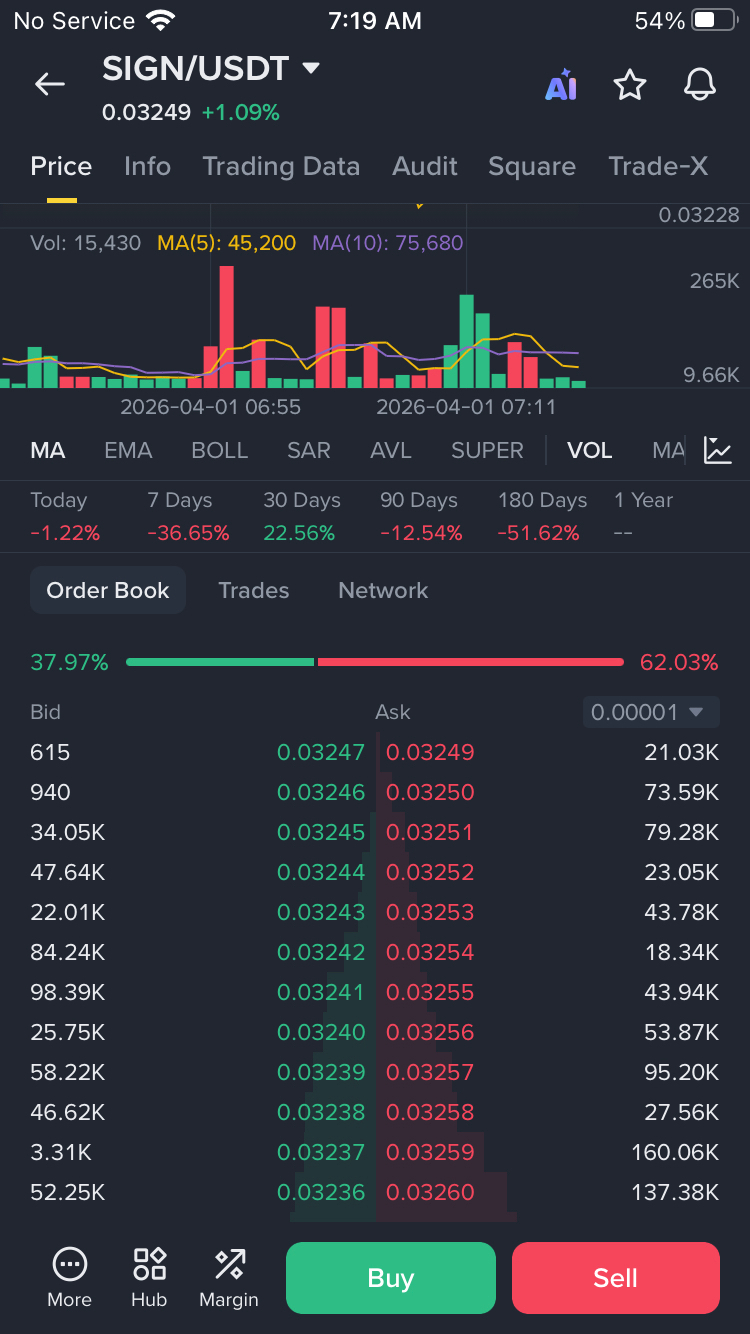
📌 Key Levels to Watch:
· A clean 4H candle above $0.0440 could trigger a run toward $0.0485.
· Losing $0.0395 would invalidate the short-term setup.
💡 Outlook:
Patience is key here. If buyers defend the current support zone, a breakout attempt is likely within the next 24-48 hours.
What’s your move on $SIGN? Buying the dip or waiting for confirmation?
#SIGN #Altcoins #CryptoAnalysis #Binance #TradingView