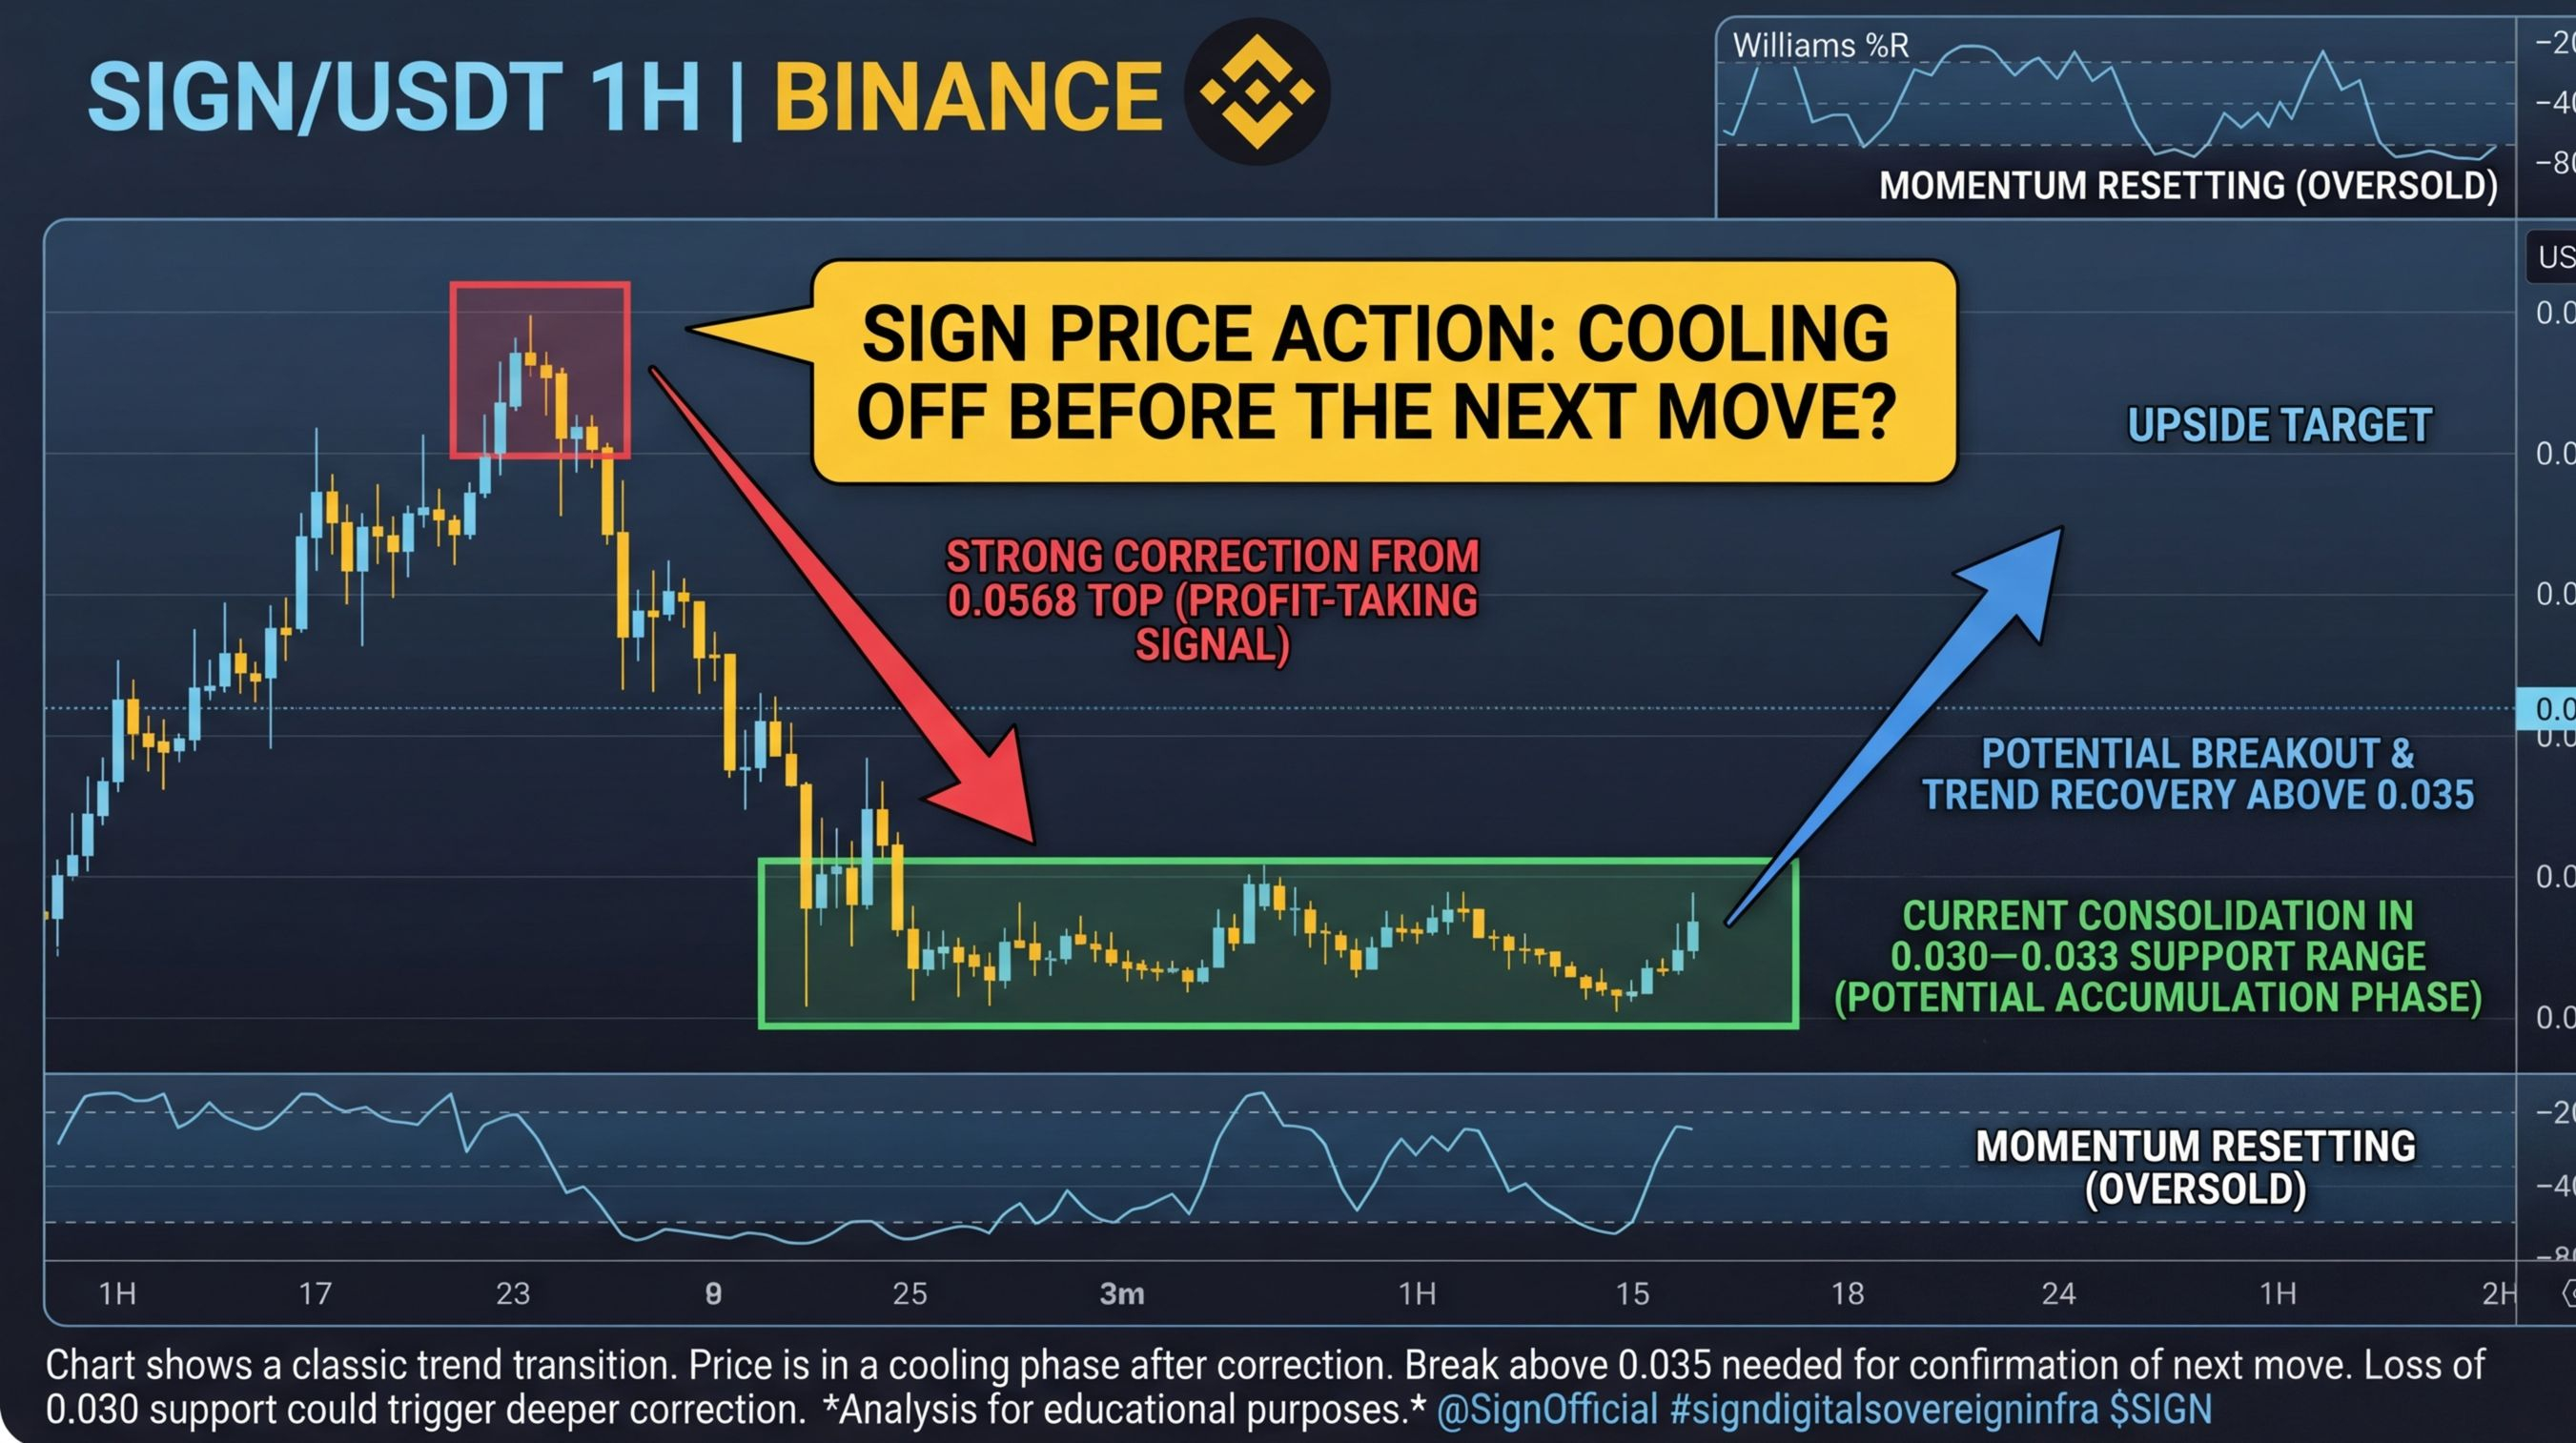
The SIGN/USDT 1H chart shows a classic trend transition from bullish momentum into a strong correction followed by early-stage consolidation. Price previously pushed up to the 0.0568 region, forming a clear local top after an extended rally. This peak was followed by a sharp and aggressive sell-off, which quickly erased gains and drove the market down to the 0.0308 support zone. Such a fast drop typically signals profit-taking and a shift from distribution into a potential accumulation phase.
Since the drop, price has been moving sideways in a tight range between approximately 0.030–0.033. This range-bound behavior is important because it shows that selling pressure is weakening and volatility is compressing. Markets often move from expansion to compression before the next major breakout. The repeated bounces from the 0.030 area confirm that buyers are defending this level as a strong demand zone.
Williams %R is hovering around the mid-to-oversold region, which indicates that the market is no longer overheated and momentum is slowly resetting. This type of structure often appears before a relief rally or a trend reversal if accumulation continues.
If buyers manage to push price above 0.035, the next upside targets could be 0.041 → 0.046 → 0.052. A break above these levels would signal a potential trend recovery. On the downside, losing the 0.030 support could trigger another liquidity sweep toward deeper levels before a true reversal forms.
Overall, the chart suggests the market is currently in a cooling and accumulation phase after a strong correction. Patience and confirmation will be key, as consolidation zones often precede significant volatility expansions.
@SignOfficial #SignDigitalSovereignInfra $SIGN