A clear analysis (neither 'hopium' nor pessimism)
🧠 Quick context
Bitcoin is known for its high volatility — it often makes large moves up and down. After a historic peak, it is not uncommon for the price to correct significantly before resuming. �
CCN.com
Currently (early 2026), Bitcoin is hovering around levels much higher than $60,000, but several indicators and analyses suggest that a pullback to this area is not excluded — far from it. �
CoinGecko
📉 Why a return to ~60,000 $ is possible
🔹 1. Deep retracements are part of BTC history
In previous cycles, Bitcoin has often corrected by about 30% to 60% from peaks before stabilizing or moving upward.
➡️ For example, if BTC were coming from a peak at ~120,000 $, a correction of ~50% would place it around ~60,000 $.
tradingnews.com
🔹 2. Technical models show support around 60,000 $
When analysts look at Fibonacci levels, moving averages, or the areas where buyers have historically engaged, significant support zones appear between ~60,000 $ and ~65,000 $.
➡️ These levels are often areas where the price rebounds or accumulates before moving again.
Brave New Coin
🔹 3. Analysts' 'market bottom' projections include this area
Several forecasts — even in rather 'bearish' scenarios — place the likely floor for future lows around $60,000–$65,000 in the upcoming cycle.
➡️ This comes from analyses based on retracements, historical patterns, and technical indicators that have worked well in the past.
CoinGecko +1
📊 A bit of context 'market cycles'
Bitcoin often operates in long cycles of ~4 years linked to halving (reduction of mining rewards). After major peaks, there are often:
Profit-taking phase
Consolidation / correction
Returning accumulators
New bullish impulse
This cyclical structure makes a rebalancing zone around ~60,000 $ more plausible even after a strong increase.
tradingnews.com
🧱 Realistic scenario: market structure
➡️ Long-term bullish
Even though BTC is in a global bullish trend over several years, the price can correct in several stages before starting the next major increase.
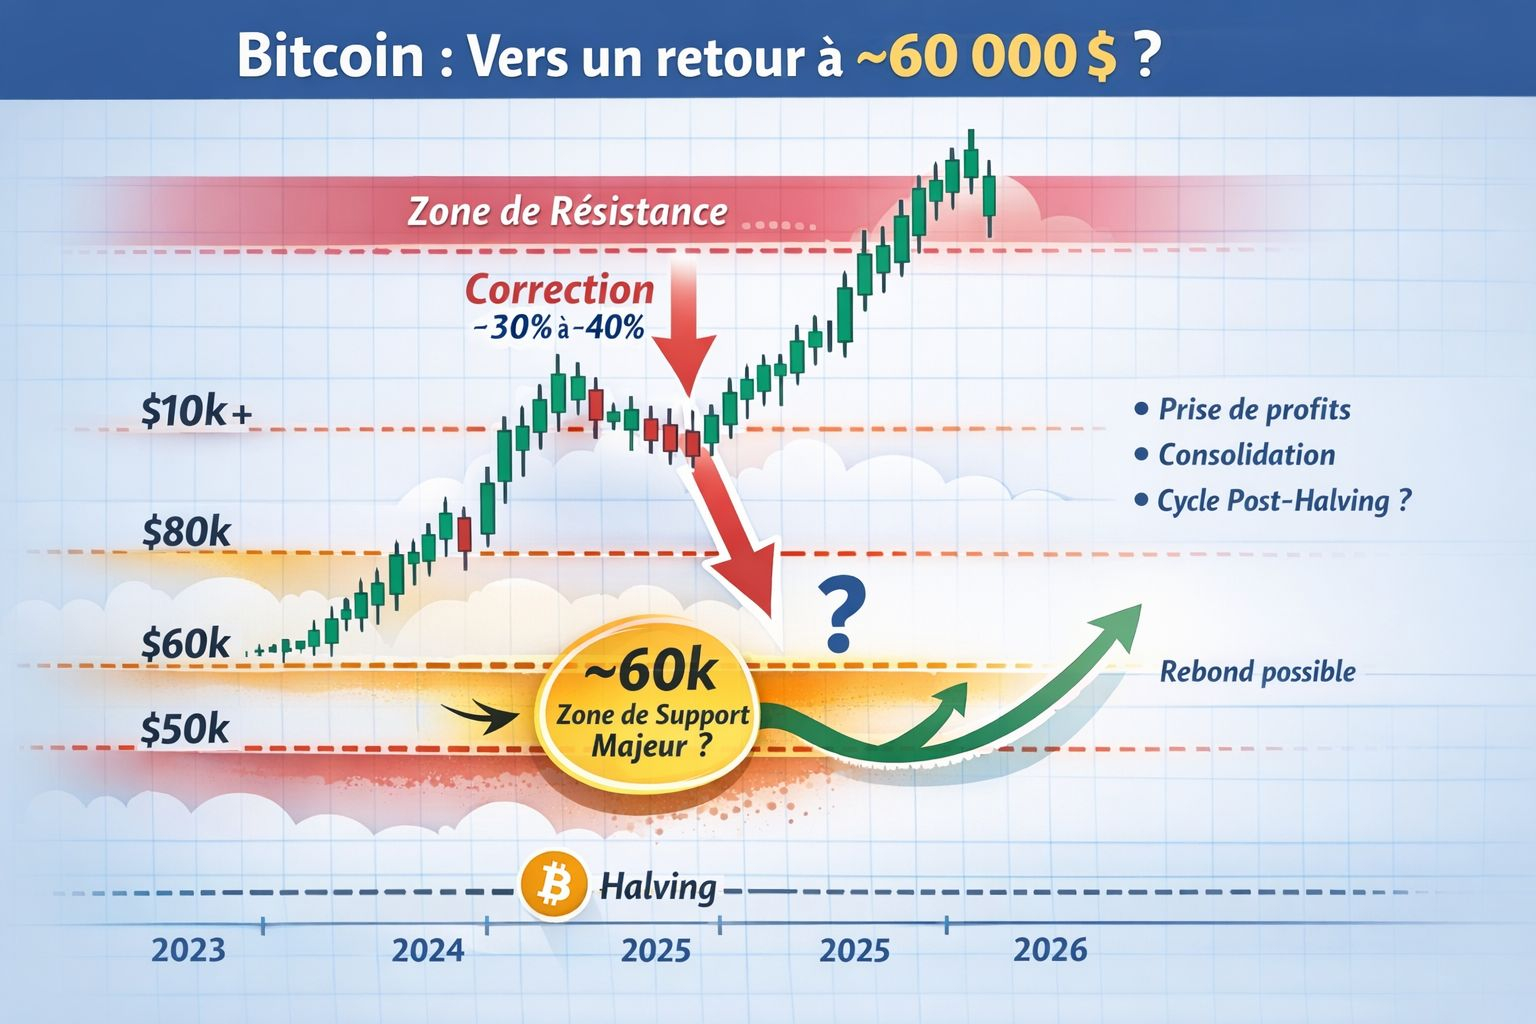
➡️ Key zones to watch
Level
Meaning
~100,000 $+
Strong psychological resistance
~80,000 $
Intermediate support
~60,000 $
Potential major support (cycle)
~50,000 $
Lowest level in very negative scenario
👉 This table is based on technical support/resistance levels used by market analysts.
interactivecrypto.com
🧩 A word on probability
🔸 Possible? Yes
A move towards ~60,000 $ is technically plausible if the price breaks several intermediate supports.
🔸 Likely? Not certain
This scenario will depend on factors like:
investor sentiment
macroeconomic data
institutional flows
trading volumes
Some analysts even see more aggressive scenarios towards lower levels (~50,000 $), while others see rebounds before even reaching 60,000 $.
tradingnews.com
🧠 Conclusion — Without 'hopium' or fear
👇 What we can take away:
✅ The idea of a return to ~60,000 $ is technically quite possible
✔️ It relies on classic retracements
✔️ It is part of the scenarios accepted by several analysts
✔️ It reflects a possible consolidation in a volatile market
❌ It is not an automatic or 'inevitable' scenario, just a plausible option among several.
📈 Bitcoin may very well rebound beforehand, or conversely go even lower — it all depends on the macro context and investors' risk appetite.