Solana (SOL) shows early signs of stabilization after a sharp market decline. Over the past seven days, the asset has lost about 15.5% of its value. The decline intensified amid overall market sell-offs between January 31 and February 1.
At the lowest point, the price dropped to $95.87, but then found local support. Since then, the quotes have bounced back almost by 8% and are trading around $103.15. This bounce has allowed for the recovery of a large part of the recent losses. Moreover, the price movement is accompanied by an improvement in capital flow indicators. This indicates a return of buyers; however, risks remain.
========
Activity of large capital at the support level
The recent price decline followed a clear technical pattern. On the daily chart, SOL completed the formation of the 'head and shoulders' pattern at the end of January. The calculated target for the decline indicated the range of $95–$96.
This level was reached almost perfectly at $95.87.
After touching the bottom, selling pressure noticeably weakened. Buyers began to return to the market. This is confirmed by the Chaikin Money Flow (CMF) indicator. It tracks capital movement into the asset using price and volume data. An increase in the indicator signals accumulation of positions by large investors.
From January 27 to February 3, the price of SOL decreased, however, the CMF moved upwards. This situation is called bullish divergence. It means that money continued to flow into the asset even amid falling quotes.
Such behavior is atypical for sharp corrections. Usually, the cash flow decreases along with the price. In this case, the rise in CMF indicates that institutional investors found the $95–$96 zone attractive for entry.
Currently, the indicator is approaching the zero mark. Crossing this line will confirm the predominance of buying pressure over selling pressure. This will strengthen the arguments in favor of recovery. Data shows that the defense of the $96 level was not random. It was supported by large capital.
========
The behavior of long-term holders and speculators
For sustainable growth, support from long-term investors is necessary. In the case of Solana, this is confirmed by data from the Liveliness indicator. This metric measures the frequency of spending long-held coins. A decrease in the indicator suggests asset retention.
Over the past month, Liveliness for SOL has shown a downward trend.
Even during the collapse from $127 to levels below $100, no significant spikes in activity were recorded. Except for a short-term rise on January 29–30, the indicator continued to decline. Therefore, long-term holders did not succumb to panic. They preferred to hold their positions.
Such behavior confirms the hypothesis that the current decline is perceived as temporary. Nevertheless, the structure of market participants remains heterogeneous.
The HODL Waves indicator shows the distribution of coins by holding time. The data indicates that the group of short-term traders (from 1 day to 1 week) has increased their positions. Their share grew from 4.38% to 5.26% from December 31 to February 1.
This category of participants tends to buy the dips and quickly secure profits on rebounds. Their growing presence increases volatility. There is also an increased risk that the upward momentum may fade at the slightest increase in prices.
Thus, long-term investors are demonstrating confidence, while speculators are increasing their activity. This creates a mixed picture. The situation favors a short-term rebound but limits growth potential without additional inflows of institutional money.
=======
Key technical levels and targets
Against the backdrop of improving momentum, price levels become more important than indicators. The first critical support is in the range of $95.87–$96.88. This area marks the completed target for the decline.
As long as the quotes hold above this zone, the recovery scenario remains valid. Breaking support will open the way for a decline to $77. This will cancel most positive forecasts.
The nearest local resistance is located around $103.60. The asset is currently testing this area. A confident daily close above this level will signal local strength of buyers.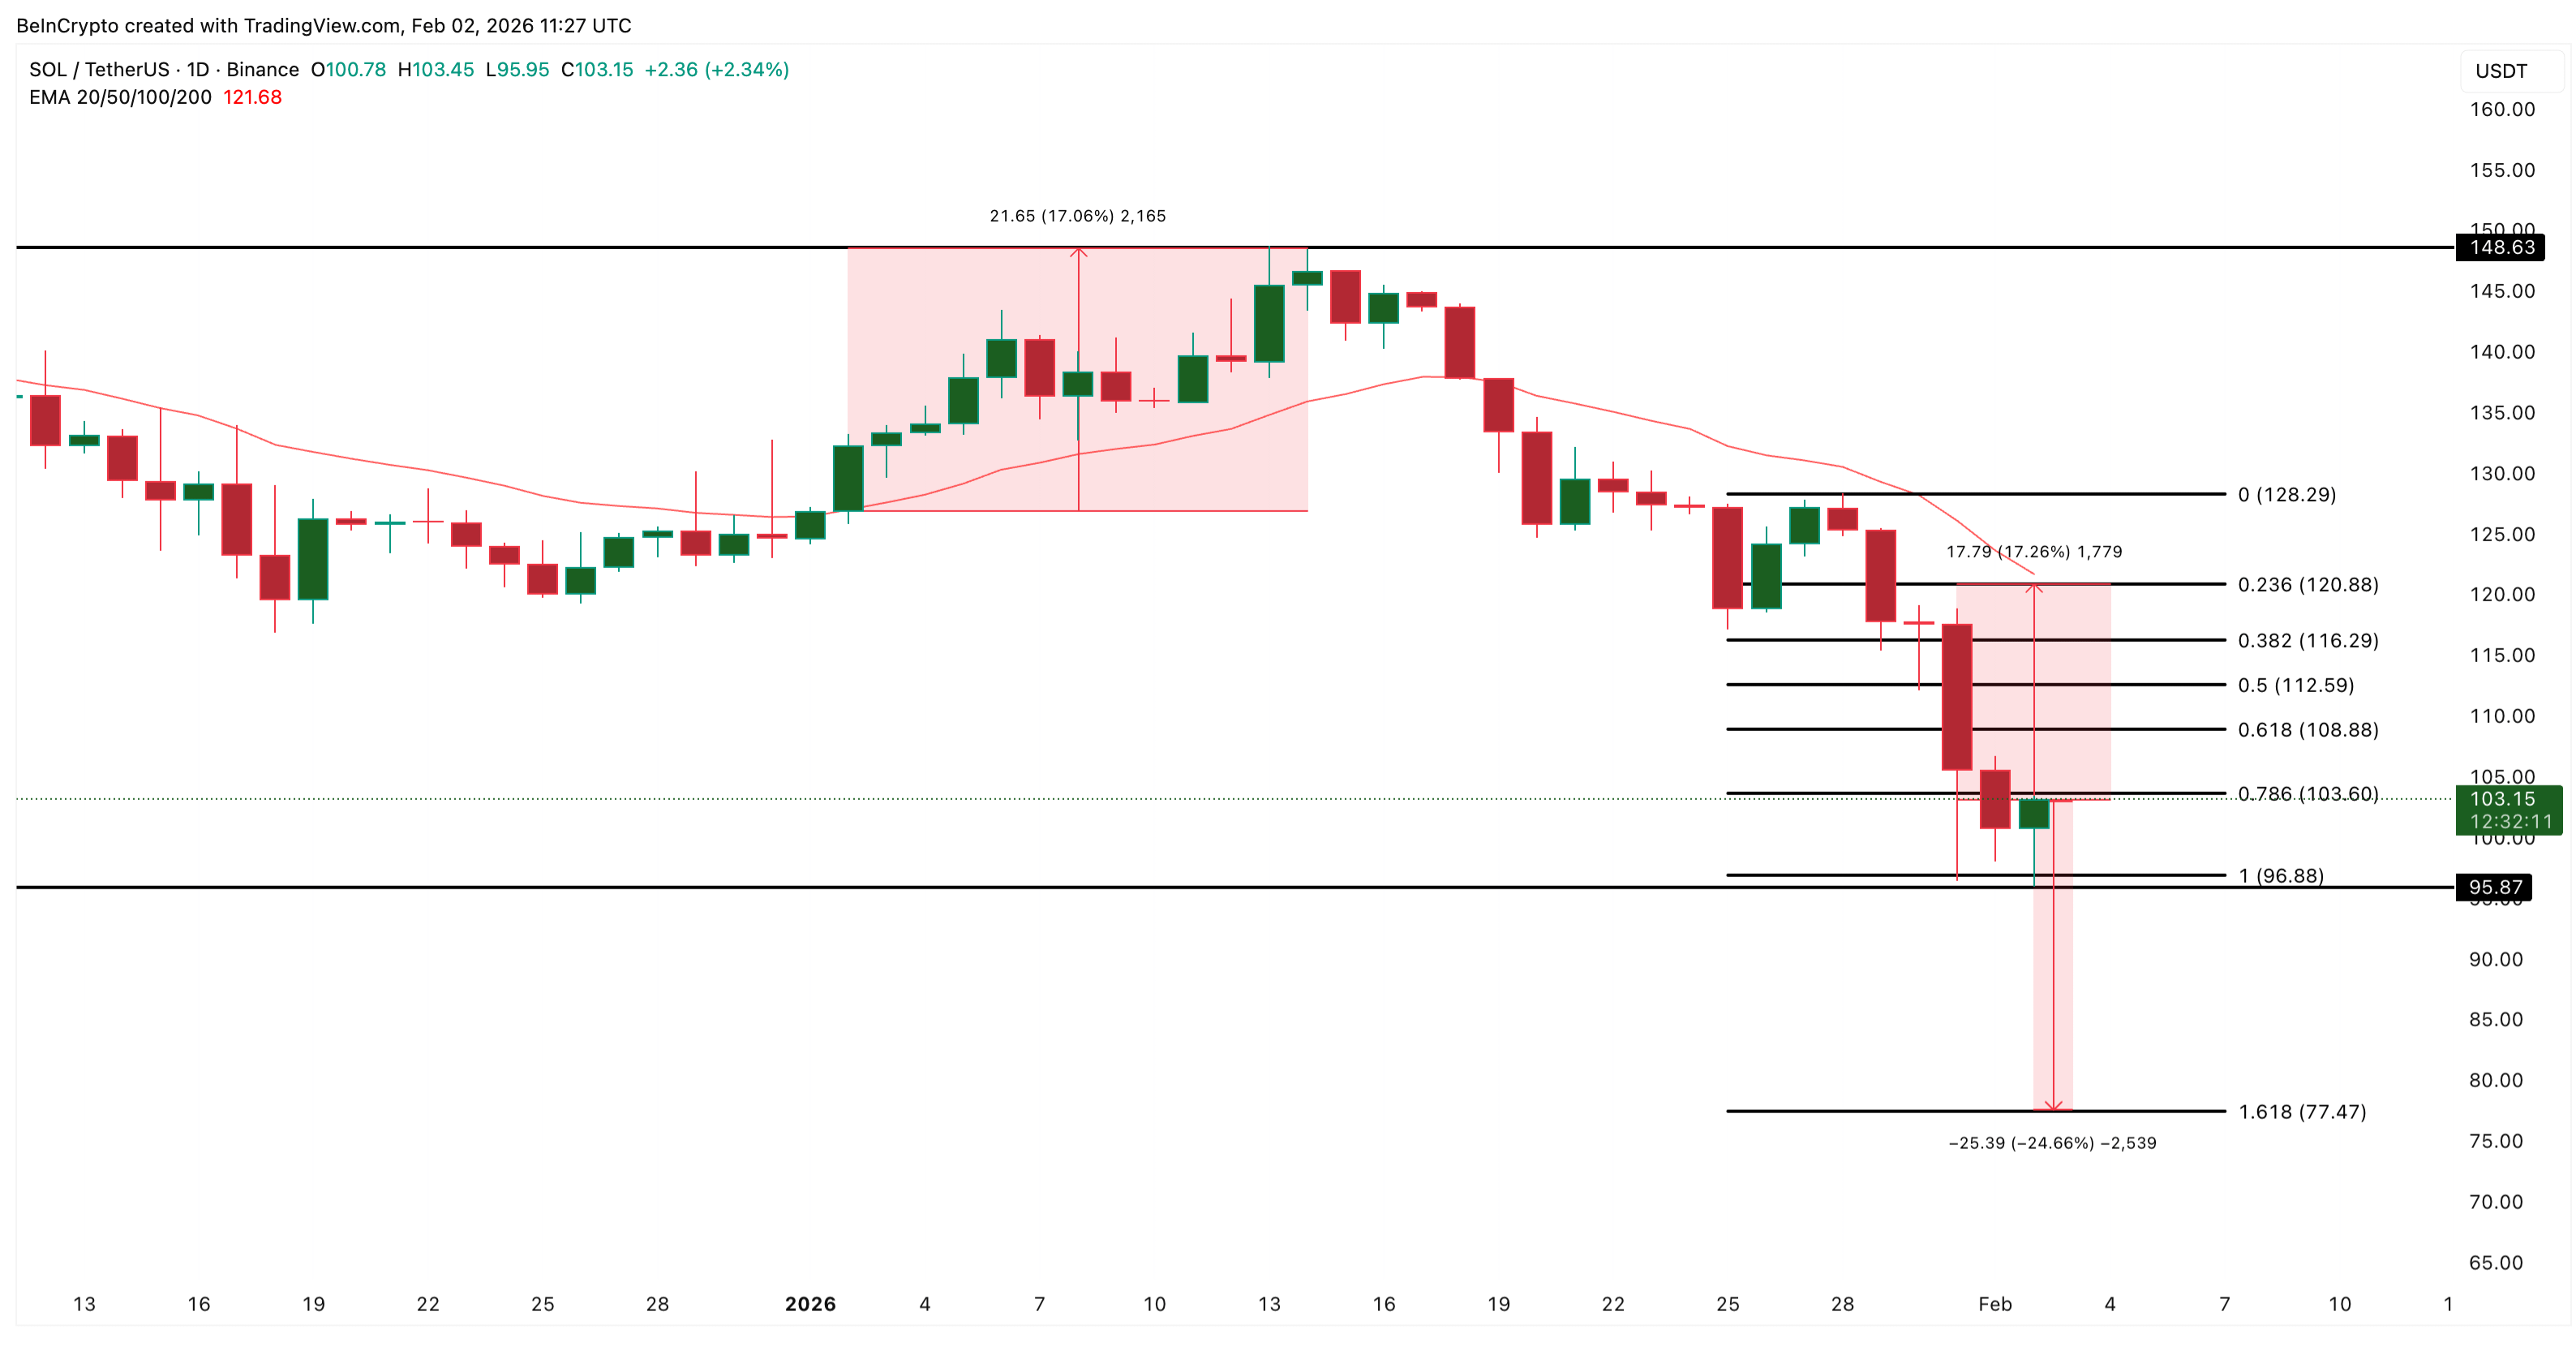
However, the most important threshold is the level of $120.88. It is significant for three reasons:
Here the trend broke on January 29.
The level coincides with the 20-day exponential moving average (EMA), which acts as dynamic resistance.
A successful return above this zone at the beginning of January previously led to a 17% increase.
A close above $120.88 on the daily chart will signal a change in initiative. This will also indicate the end of the correction phase. In this case, the next targets for buyers are at $128.29 and $148.63.
However, the realization of this scenario depends on the continued inflow of capital. If trading volumes are formed only by short-term traders, the growth may stop before reaching the specified targets.