Forecast on the Bitcoin chart
The daily chart of Bitcoin shows a market that is still recovering from a recent drop from $97,900, hitting a low of $74,532. The bounce from this low was not quite an Olympic comeback — rather an uncertain move upwards.
The price structure appears corrective rather than impulsive, implying that bulls are more likely to be stretching sore muscles than confidently moving forward.
Strong resistance remains stubborn between $88,000 and $90,000, while support in the range of $74,500 to $76,000 acts like an emotional blanket for the market.
As long as Bitcoin does not enthusiastically take the $90,000 level, the overall bias remains from neutral to bearish.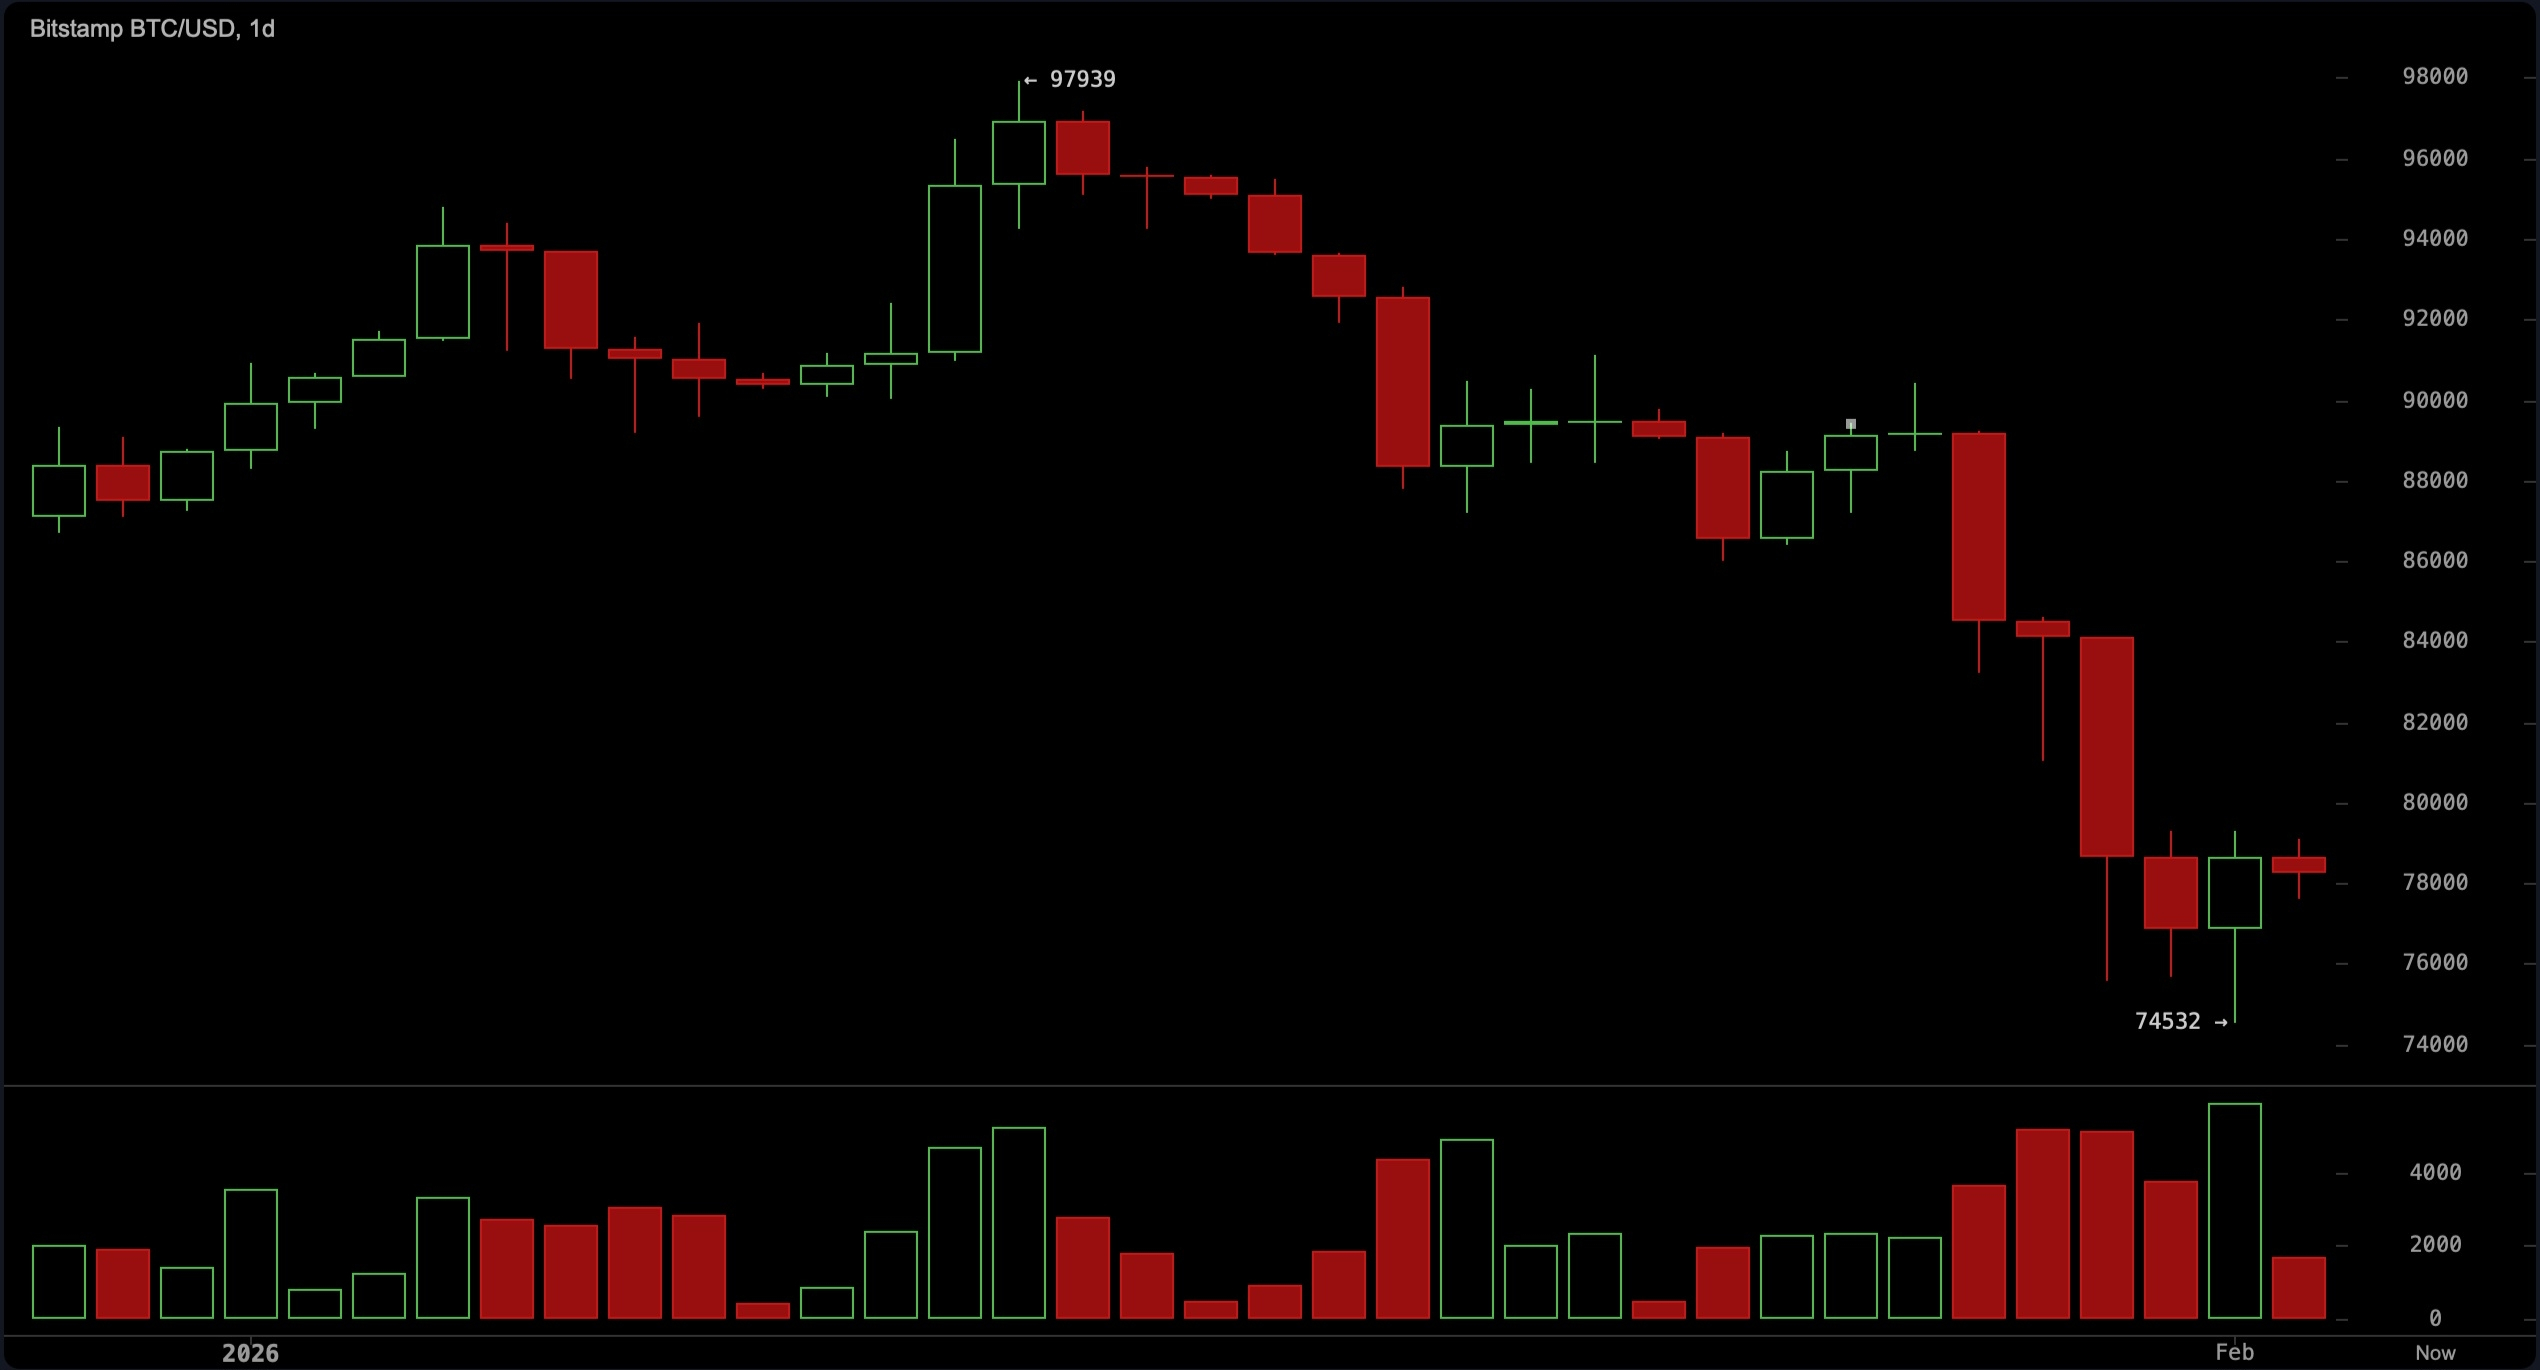
===========
On the 4-hour chart, the situation resembles a soap opera — lots of drama, but not much real change. Lower highs continue to prevail, a classic sign of waning ambition among buyers.
Price is bouncing in a narrow range between $76,000 and $79,500, indicating that traders are playing hot potato rather than building confidence.
Volume confirms this narrative: massive selling activity at lows is replaced by a rather sluggish recovery.
Any clear move above $80,000, with momentum and volume support, could change the mood. But for now, it is all just suspicion and fluctuations.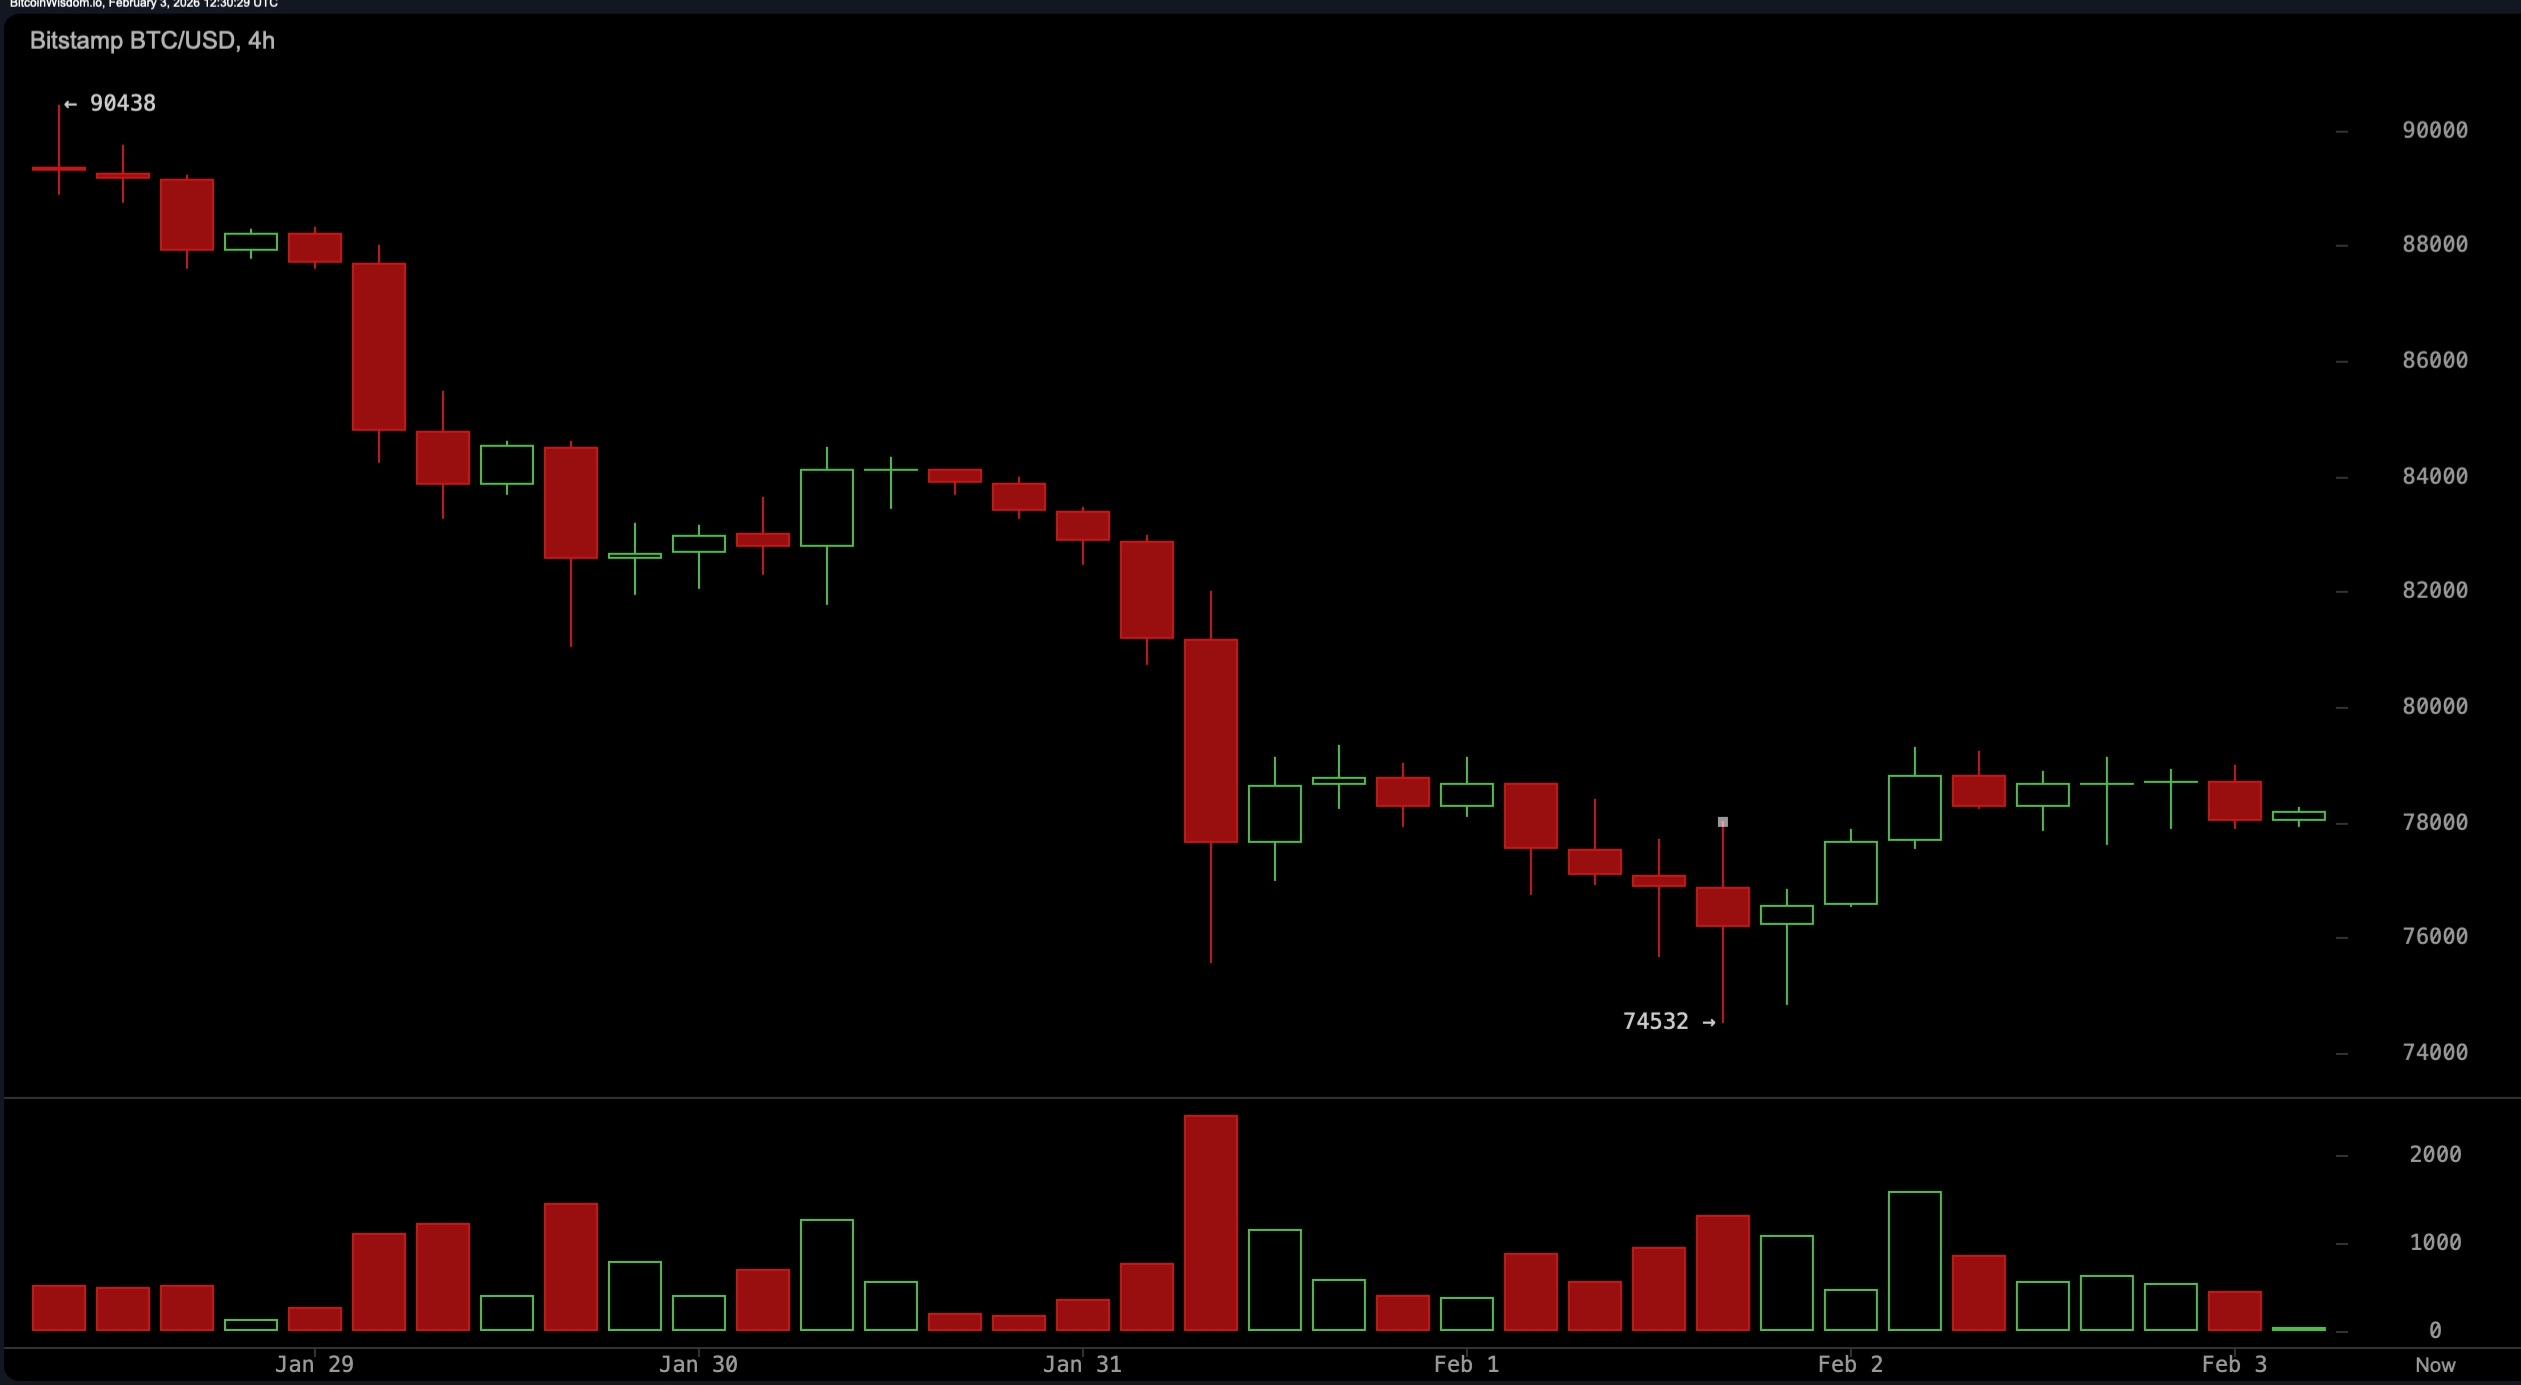
=========
Upon closer inspection of the 1-hour chart, it is clear that momentum is exhausted. After reaching around $79,301, Bitcoin has rolled into a pattern of lower highs — not the best sight on the podium of intraday trends.
Volume has decreased in this sideways stretch, indicating more confusion than confidence. The microstructure screams of a halt in momentum, which often foreshadows either a sharp spike or a rude failure.
Traders expecting breakouts should temper expectations until Bitcoin chooses a side with corresponding volume.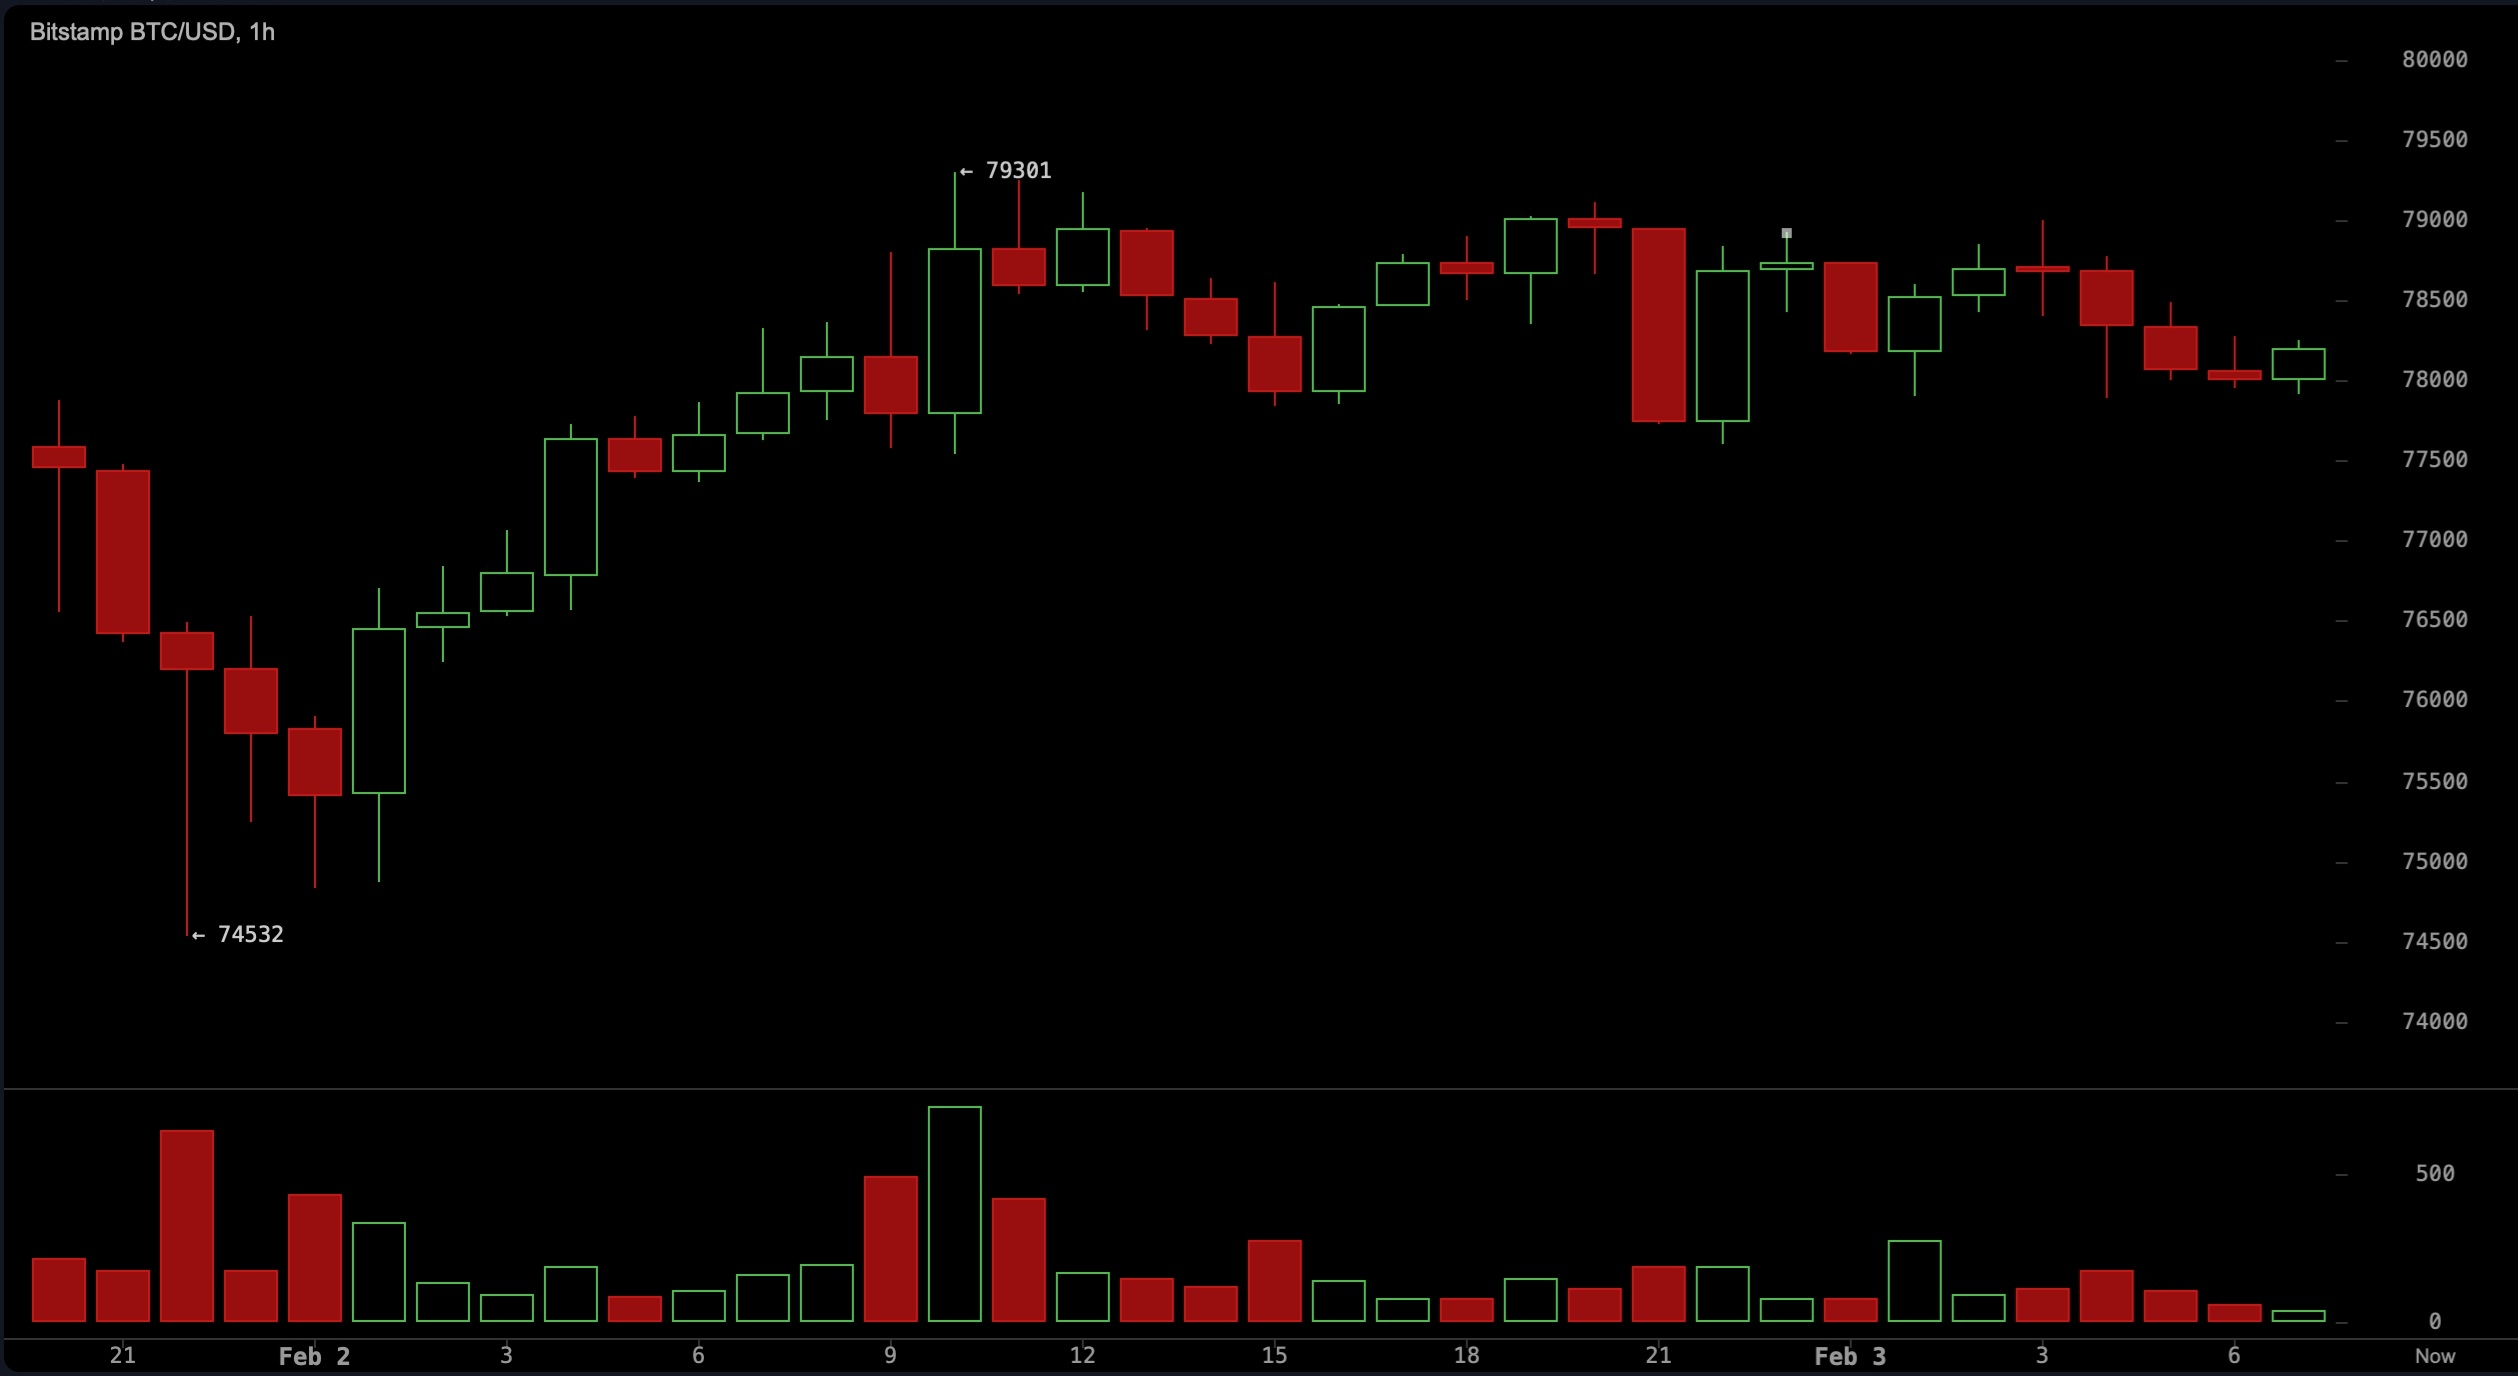
=========
Bears' Verdict:
If Bitcoin can break the $80,000 level with confidence — preferably surpassing $82,000 on strong volume — momentum may shift sharply.
Such a movement would break the current range and possibly bring trend followers back into play, especially considering signals of oversold conditions accumulating across several oscillators.
=========
Bears' Verdict:
As long as Bitcoin does not reclaim key moving averages and break the ceiling at $82,000, the path of least resistance remains downward.
The current bounce lacks both structure and strength, and the technical landscape is still littered with lower highs, heavy upper resistance, and weak momentum.