Target: BTC / USDT
Current Price: 87,450
In the past two days, Bitcoin has only done one thing:
With speed, it broke through market sentiment. From a high of 97,000, it fell all the way down, touching a low of 86,000, with panic selling, stop-loss orders, and liquidation concentrated.
But the real question is not 'how much it has dropped', but—
👉 At the current position, is the panic continuing, or is it a temporary bottom? The answer must return to the structure of the daily, four-hour, and one-hour charts.
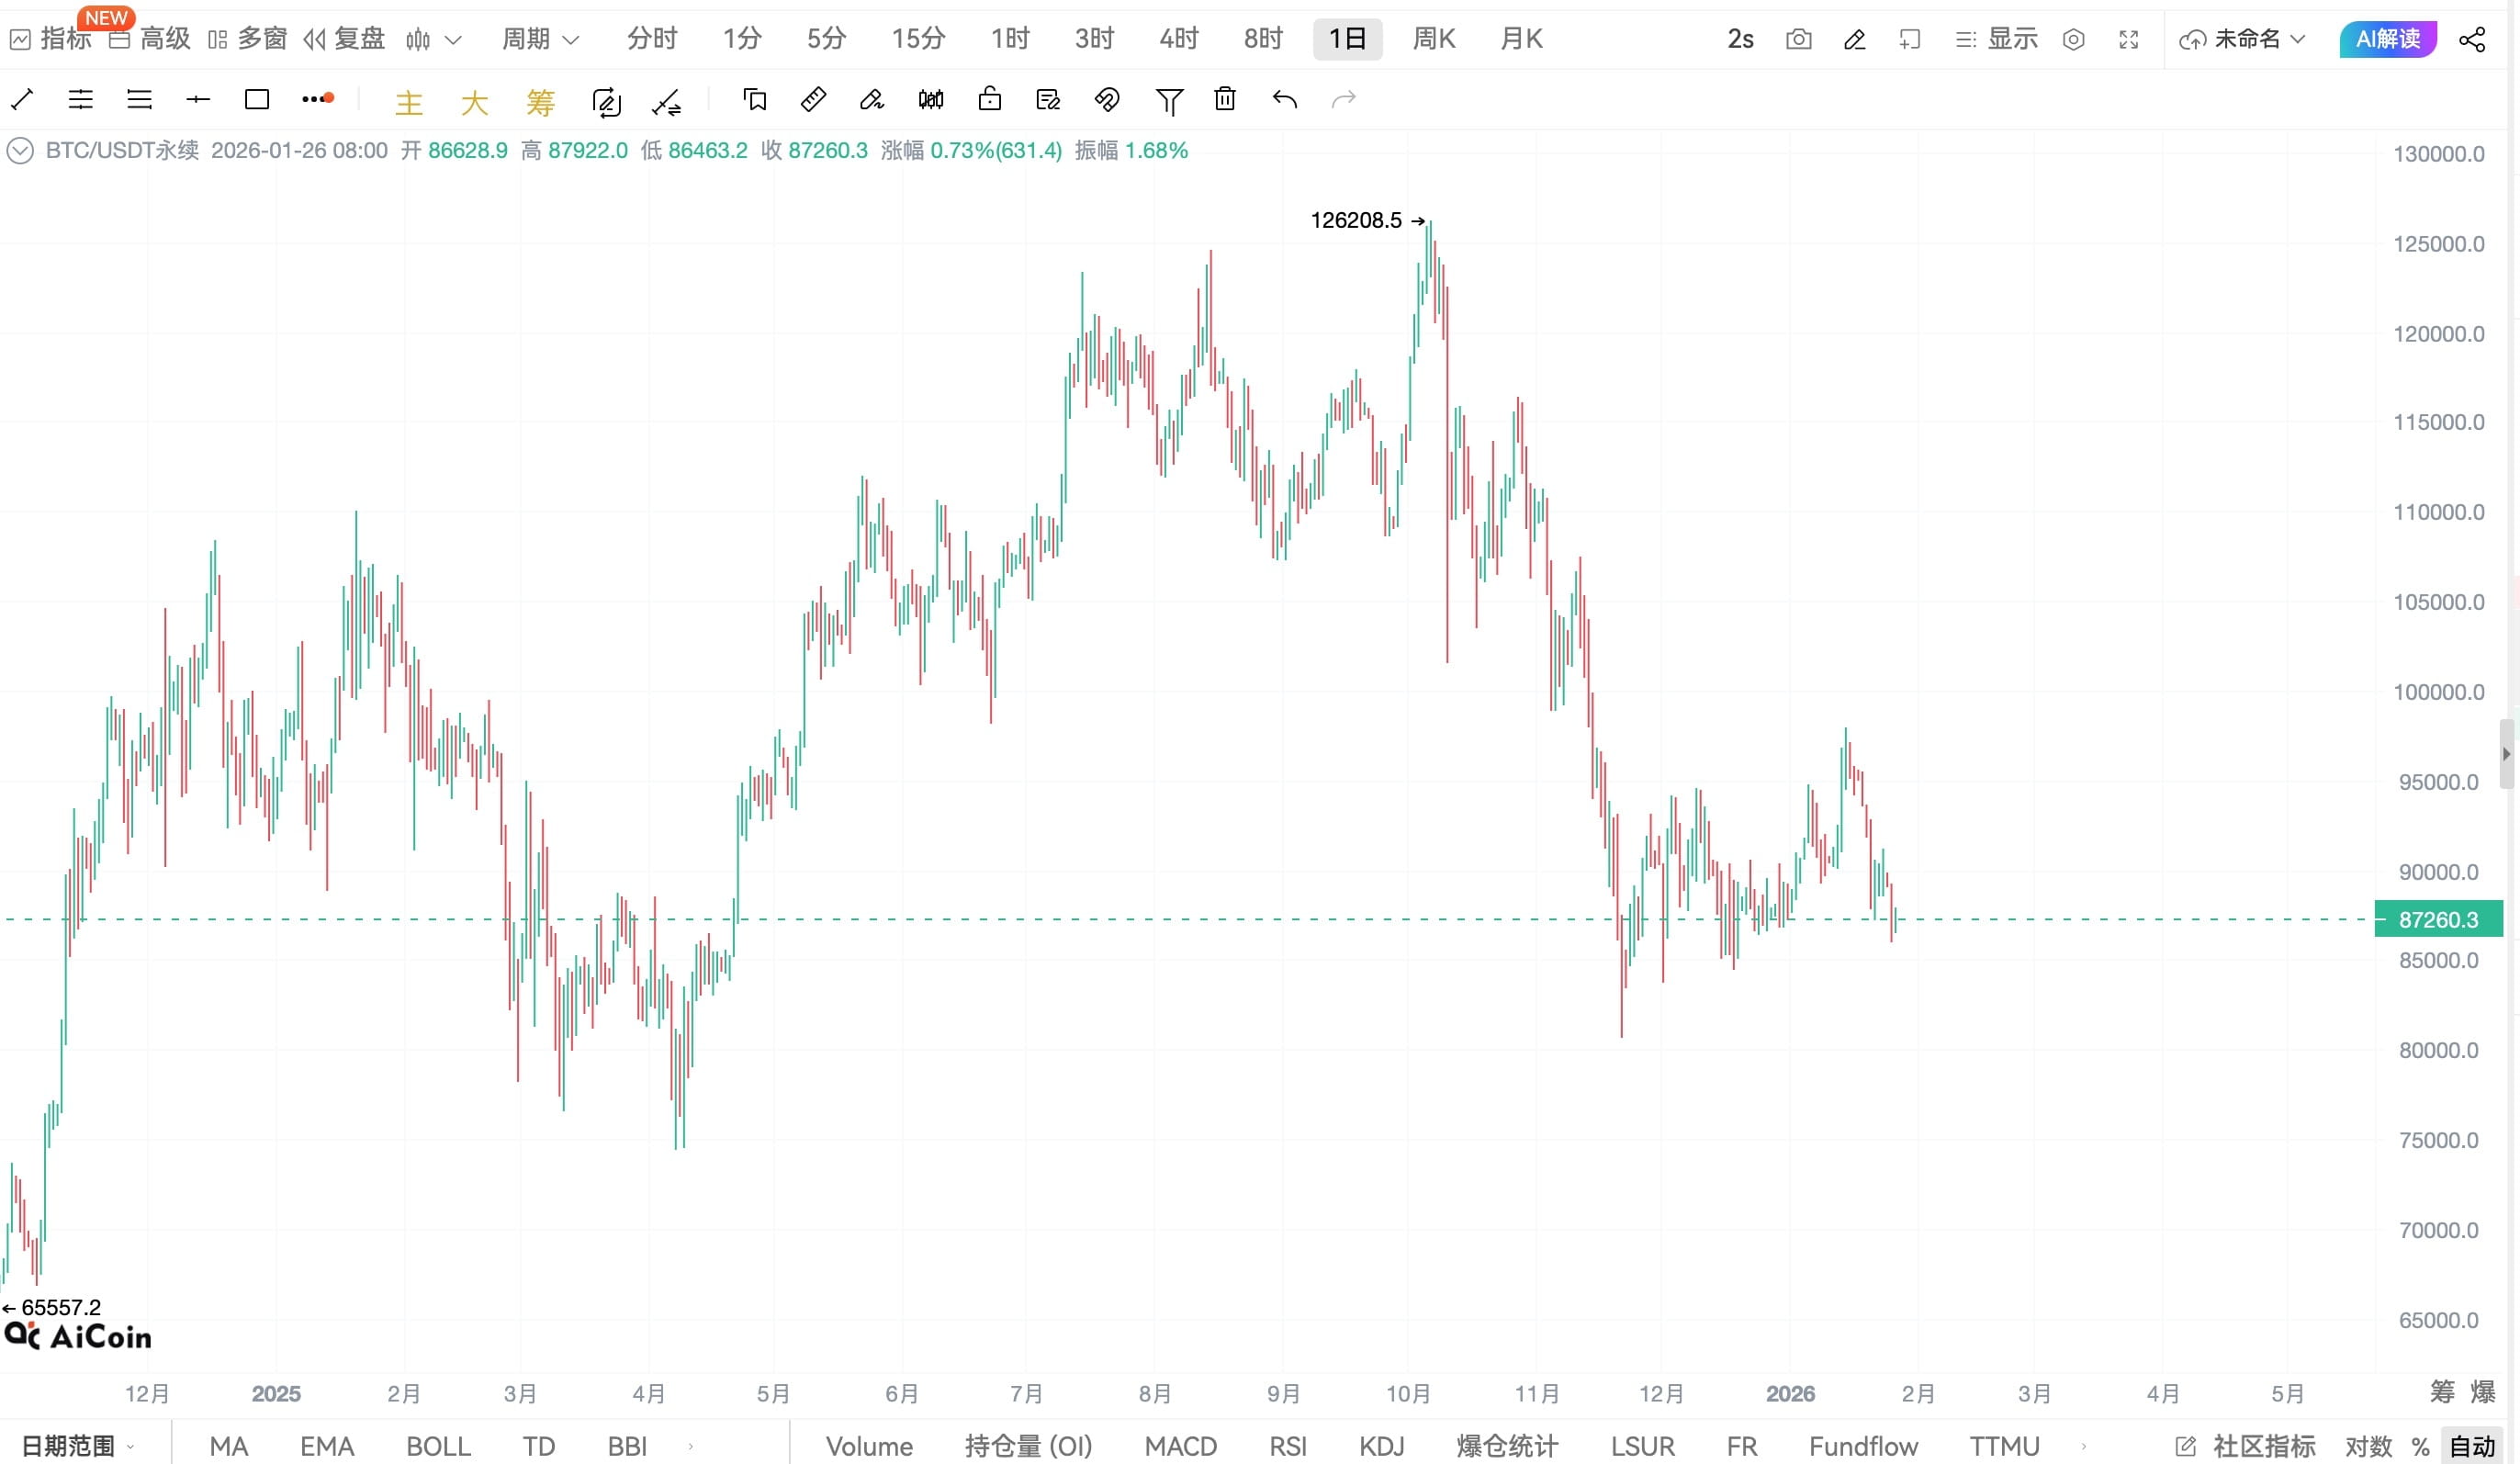
1. Daily level: Trend weakens, but has not yet declared a bear market
The daily chart determines BTC's medium-term direction.
1️⃣ Daily structure analysis.
High point: around 97,900, forming a clear stage top.
Then broke below the previous oscillation platform at 92,000.
Current lowest retracement to the 86,000 – 87,000 area.
This is a standard:
Failed to spike → Structural breakdown → Emotional accelerated decline.
But pay attention to one point:
👉 It has not yet broken below the previous round's daily key rising area.
2️⃣ Daily moving average status.
MA5, MA10 have clearly pointed down.
MA30 starts to flatten.
MA60 still maintains an upward trend.
What does this indicate?
The short-term trend has turned bearish, the mid-term trend has entered a 'danger observation period',
but it has not completely reversed.3️⃣ Key price level on the daily chart.
Daily strong support: 85,000 – 86,000.
Structural lifeline: 82,000.
Daily pressure zone: 90,000 – 92,000.
As long as 82,000 is not effectively broken down,
BTC still belongs to a large-scale adjustment, not a trend collapse.
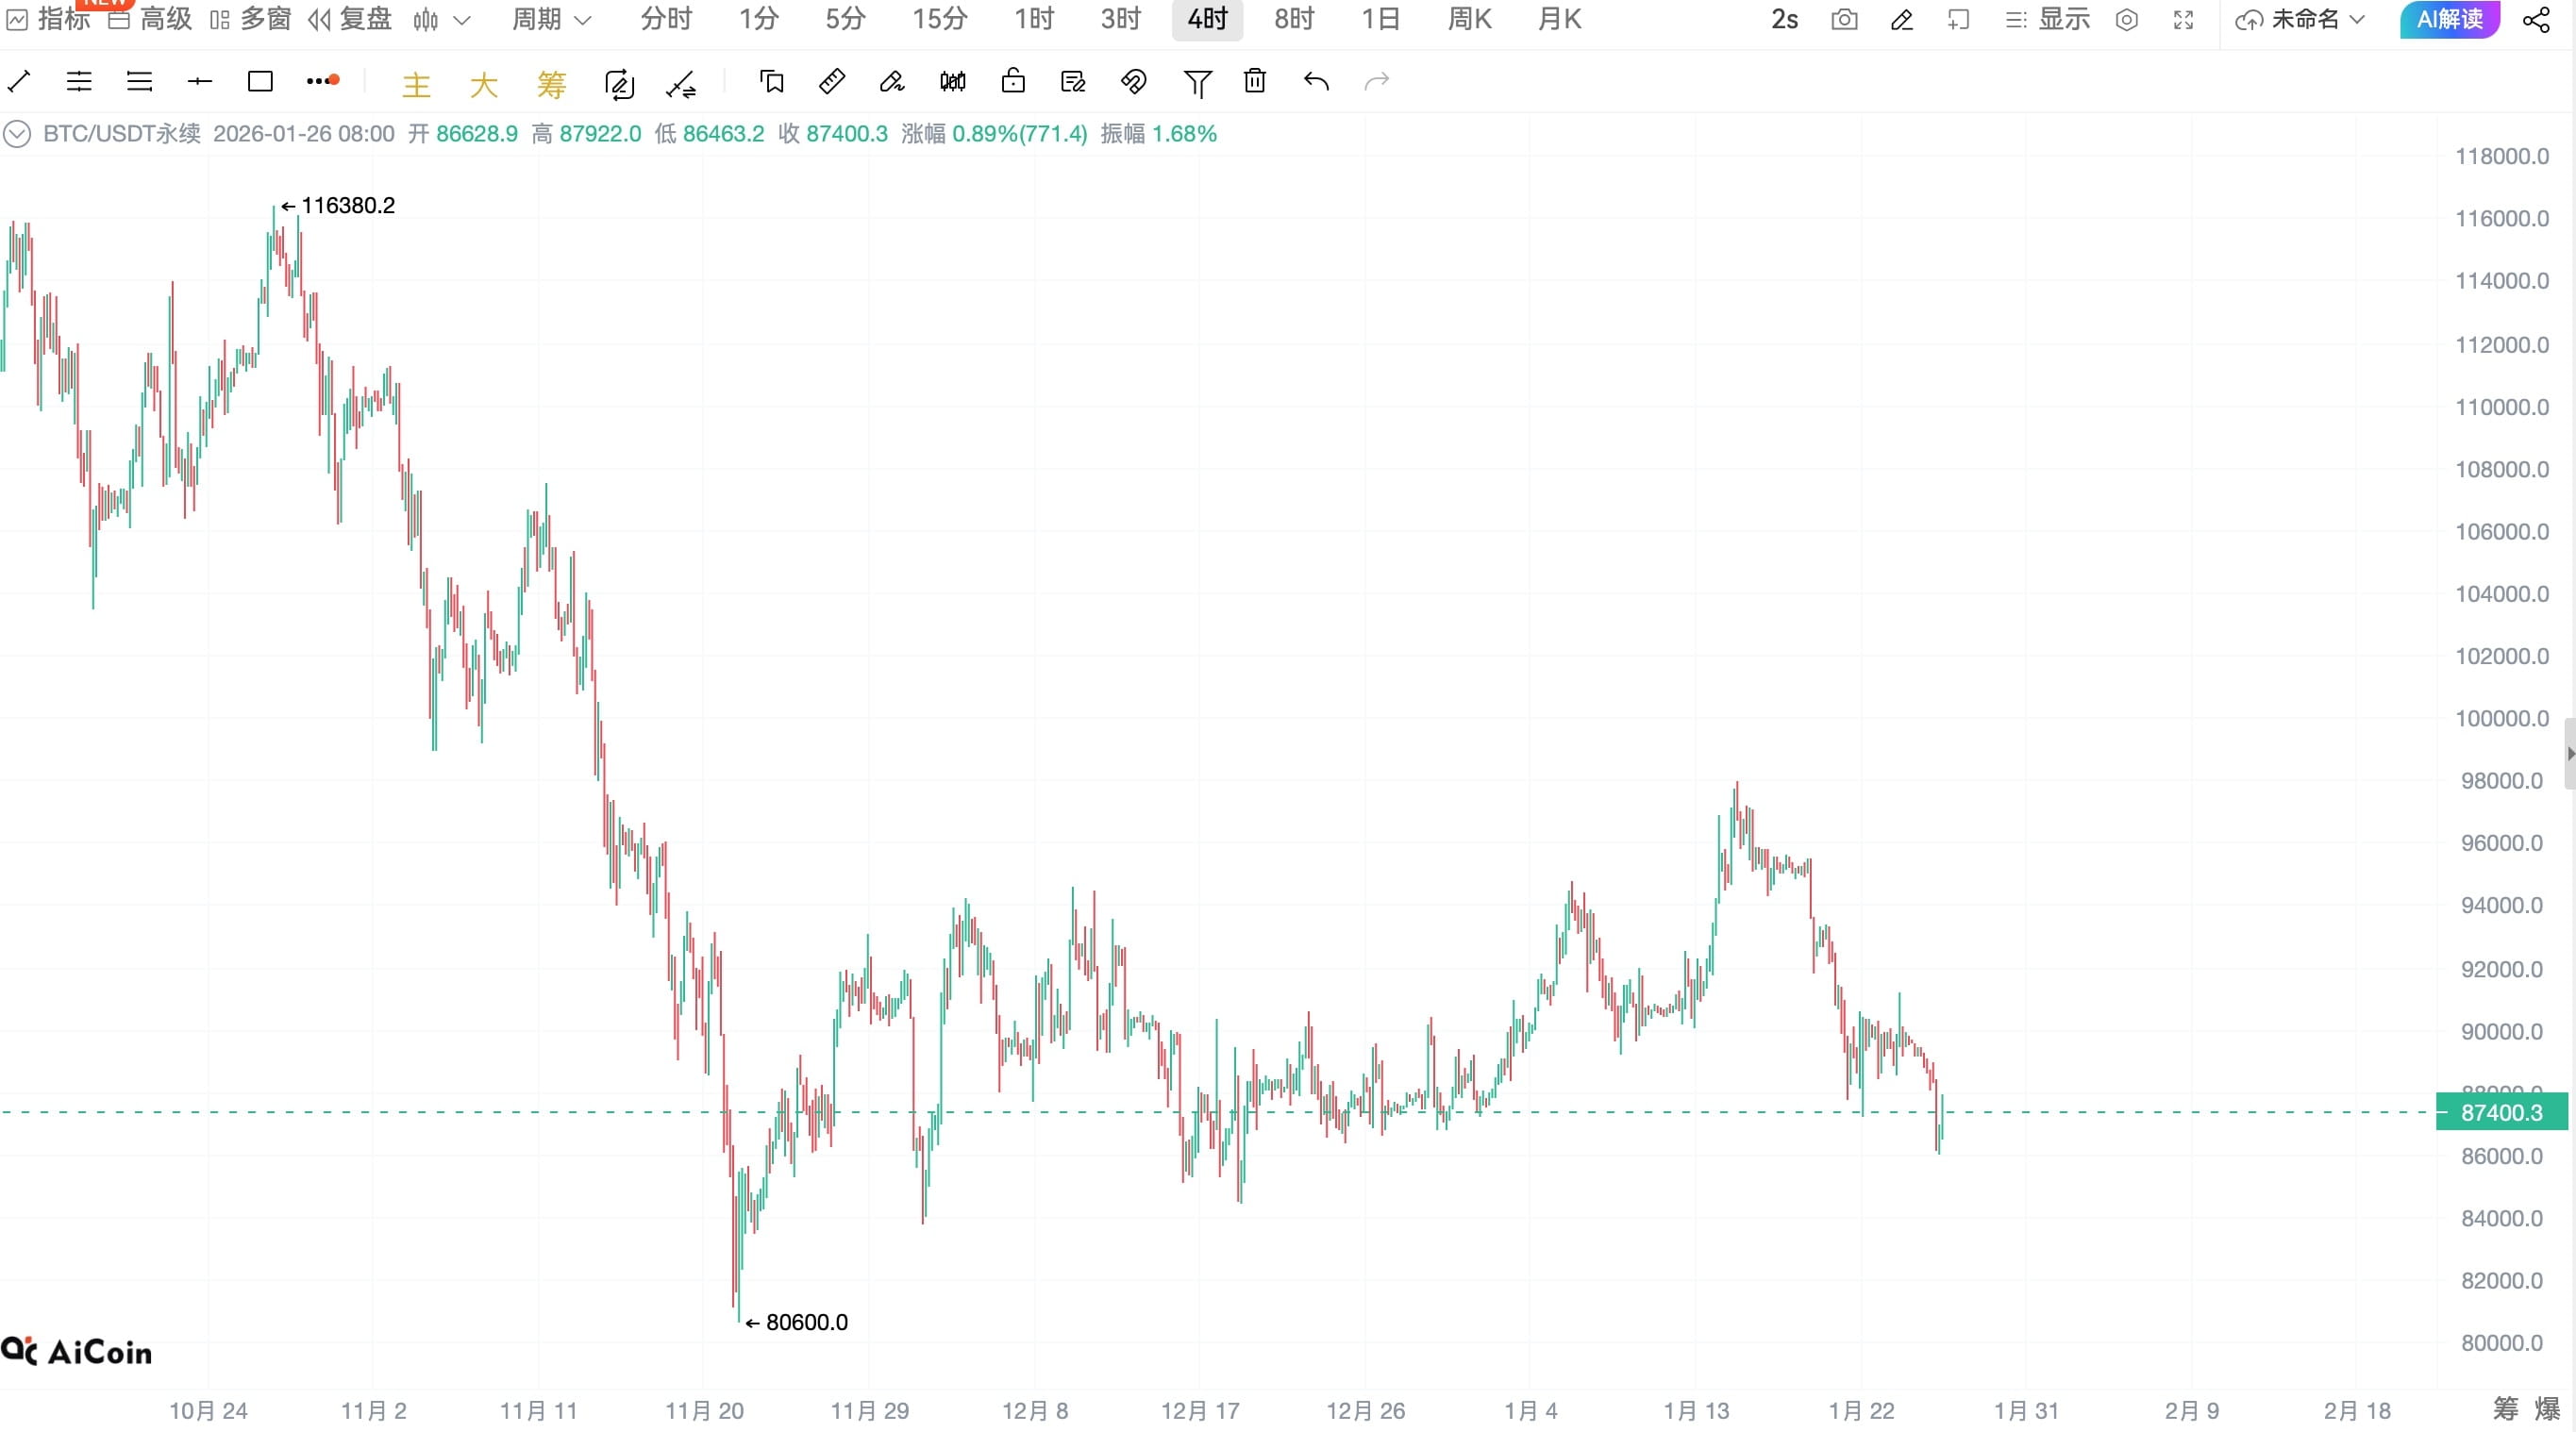
Two, four-hour level: The downtrend remains, but the selling pressure has obviously weakened.
The four-hour chart is the core cycle to judge 'whether it can bottom'.
1️⃣ Four-hour trend structure.
Typical descending channel.
Rebound highs continue to decrease.
But the latest decline speed has obviously slowed down.
👉 This is often a precursor to the exhaustion of bearish momentum.
2️⃣ Changes in trading volume.
The previous decline was accompanied by increased volume (panic release).
Recently, the new low has not released a larger trading volume.
This indicates:
Those willing to continue selling at 86,000 - 87,000 are decreasing.
3️⃣ Four-hour conclusion.
Currently not suitable for shorting,
closer to the stage of 'waiting for direction choice'.
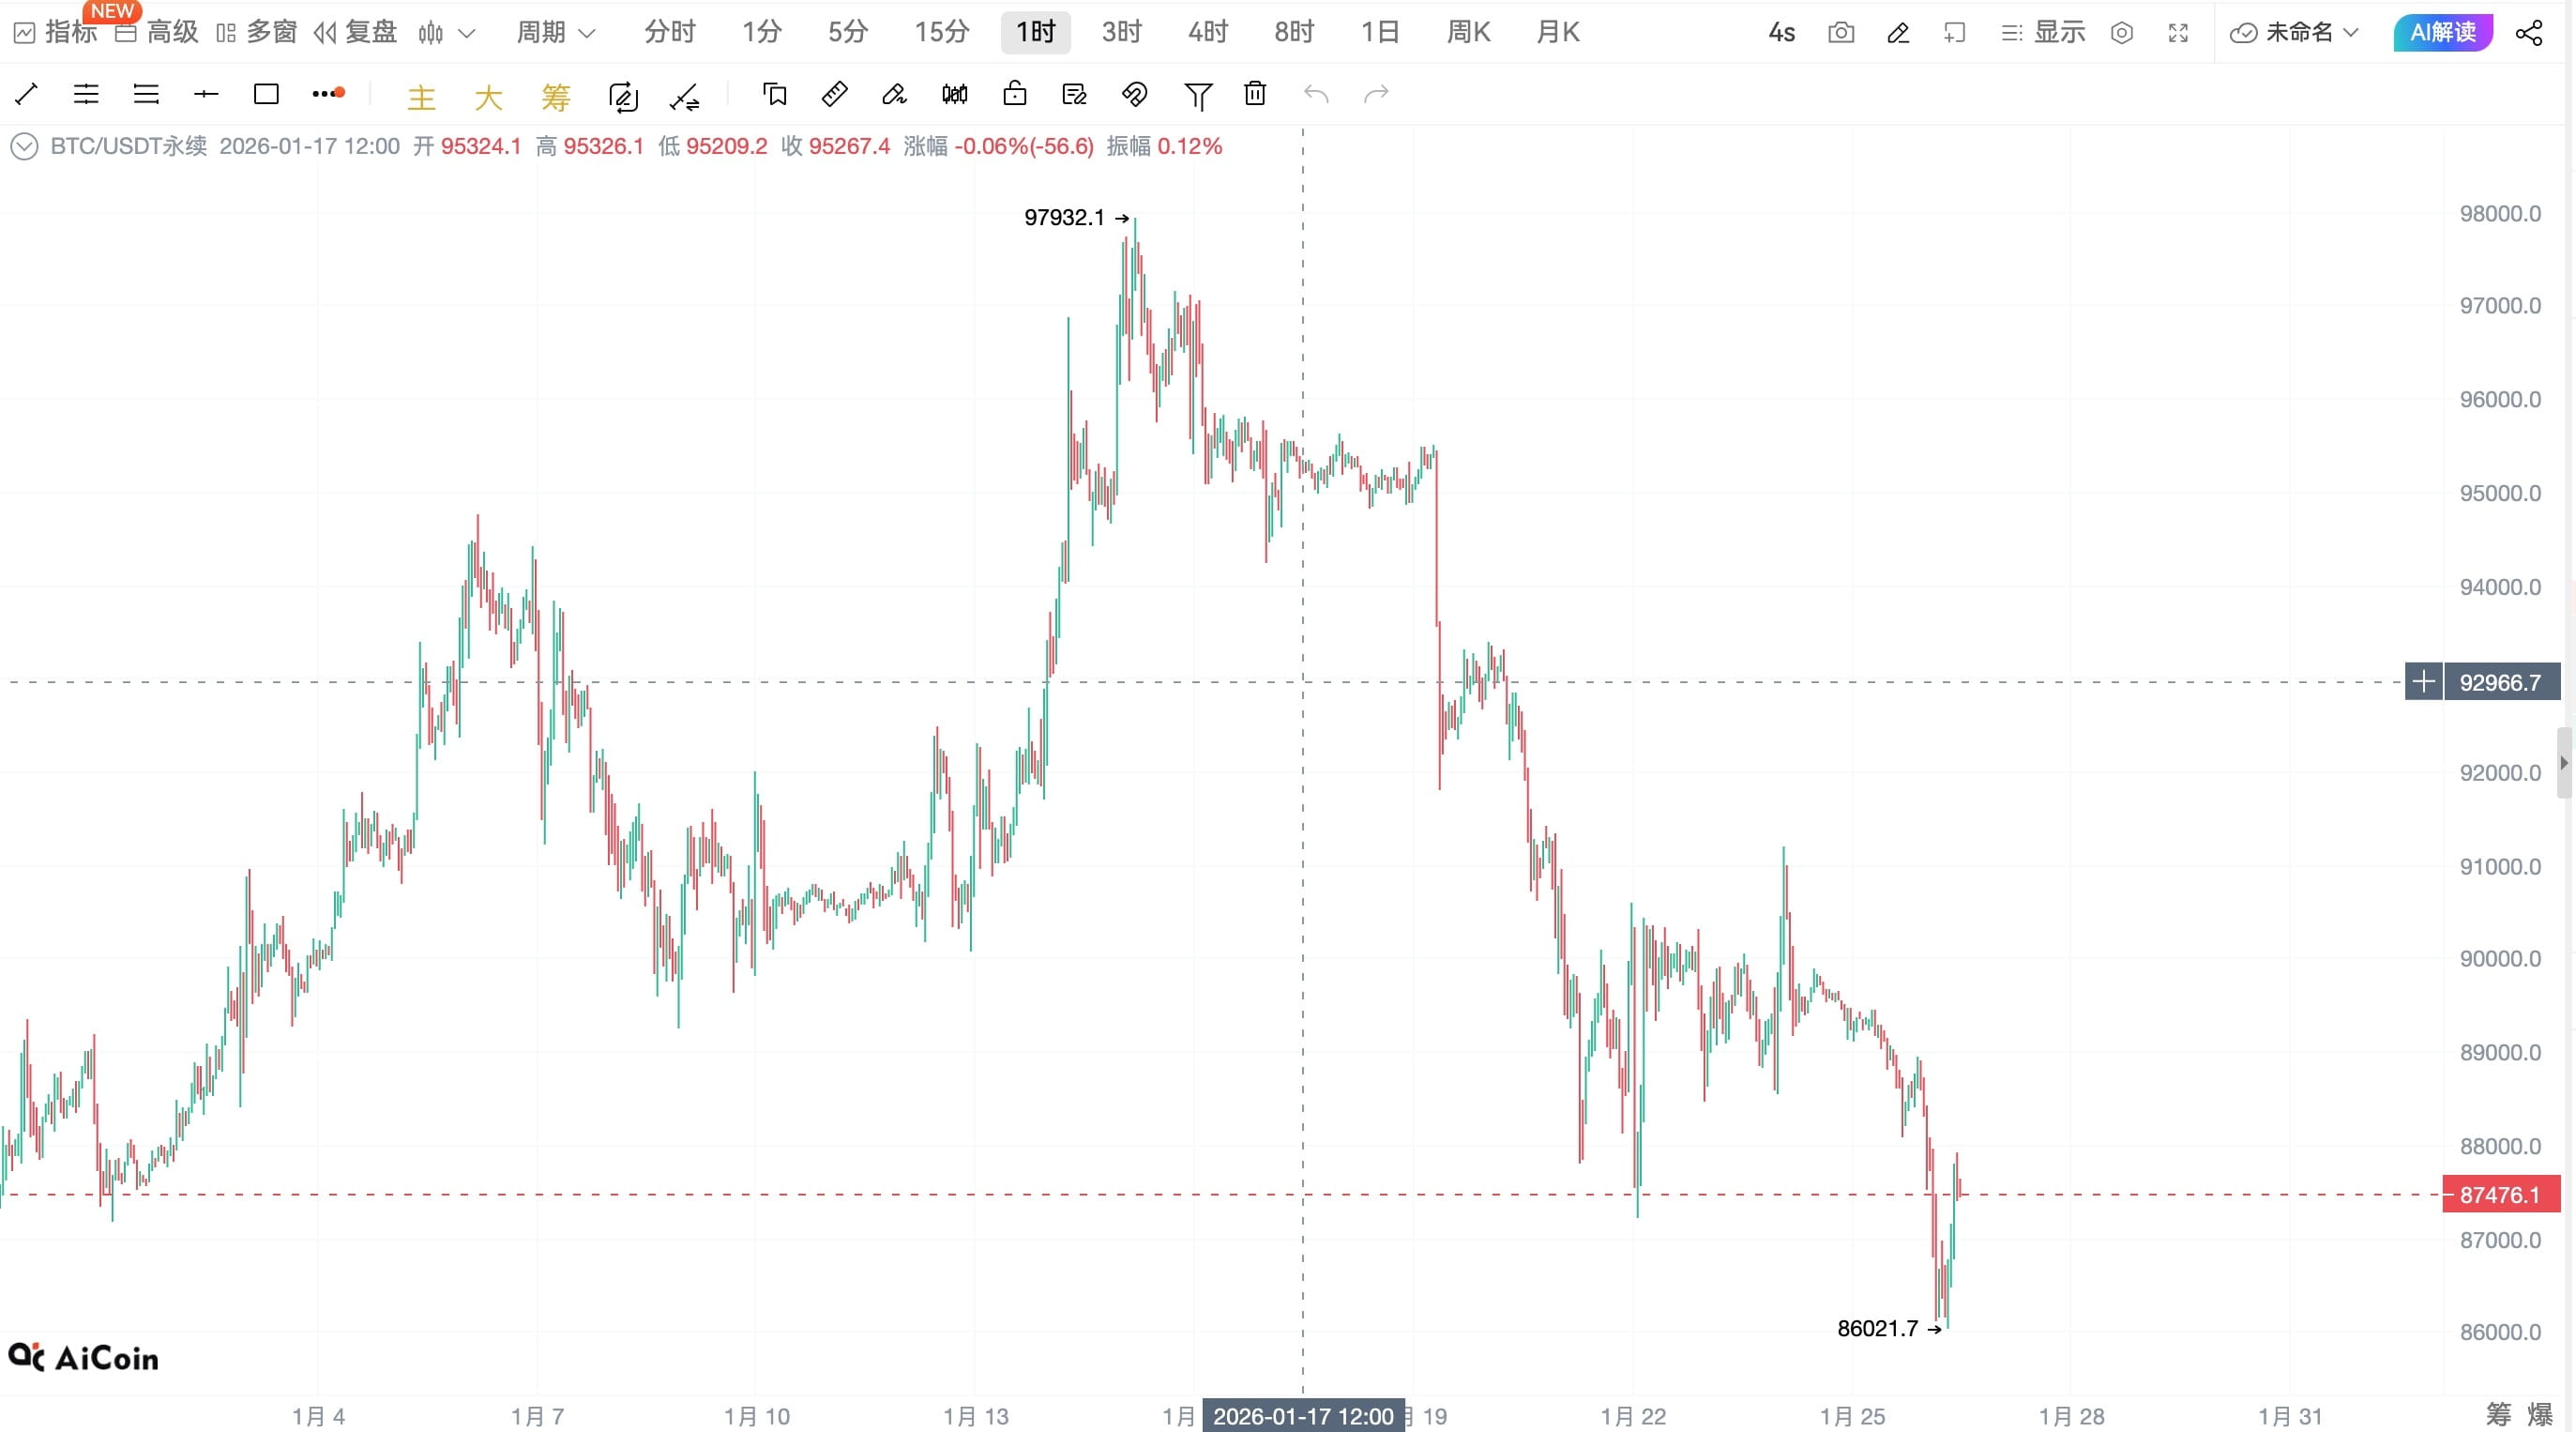
Three, one-hour level: signs of stopping decline initially appearing, but reversal has not yet been confirmed.
One hour is the key to whether it can do short-term trading today.
1️⃣ Short-term structure.
A quick spike appeared around 86,000 and then pulled back.
Continuous new lows failed.
Current price oscillating above 87,000.
👉 This is typical:
Sharp drop → Stop-loss orders released → Long and short re-gambling..
2️⃣ One-hour moving average.
MA5, MA10 start to flatten.
Price is no longer far from the moving average.
The downtrend is 'losing speed'.
3️⃣ One-hour conclusion.
The short line has entered the 'gambling zone',
but only standing firm88,500, the rebound will have more quality.
Four, the key price level that must be closely monitored today.
🔻 Support area (last defense line for bulls).
86,000 – 85,000: Short-term stopping decline area.
82,000: Daily trend life and death line.
🔺 Pressure zone (validity judgment for rebound).
88,500.: One-hour rebound confirmation level.
90,000 – 92,000.: Daily pressure zone.
If it can't return here, all rebounds can only be defined as repairs.
Five, practical operation advice (very important).
✅ Conservative type (spot / medium-term).
No chasing highs, no bottom fishing.
Testing in batches near 85,000.
Breaking below 82,000 clearly stops loss or reduces positions.
First target for rebound:92,000.
✅ Short-term / contract thought.Do not recommend shorting below 87,000.
If retracing to 86,000 does not break, you can try going long with a small position.
Stop loss: 84,800.
Short-term target: 88,500 → 90,000.
Six, a truth for all traders.
Real declines often do not complete in panic,
but end when 'no one is willing to sell anymore'.
BTC is now standing at this critical point.
This is not the safest position,
but it is definitely not a good position for emotional shorting.
In the next 48 hours,
what determines is the level of the rebound, not a few hundred dollars up or down.
Those who understand the structure are already waiting for signals;
Those who look at emotions will only be harvested back and forth.