By EssiDois da Silva
Heyyy! Heyyy! Hey! 🤣
Smooth all around?! That's it!
So... have you opened a data terminal like CoinGlass? Kind of a Matrix code vibe, huh? You're not alone. The crypto market, with all its volatility and pulsing charts, might seem chaotic to the uninitiated, but for those who master reading the signals, it transforms into a fascinating chessboard, right?
Now grab the perspective! Let's dive one level deeper down the rabbit hole. Let's understand what truly underpins the health of Bitcoin (BTC) price beyond just "up and down." Grab your coffee, because this is the real-time anatomy of the market.
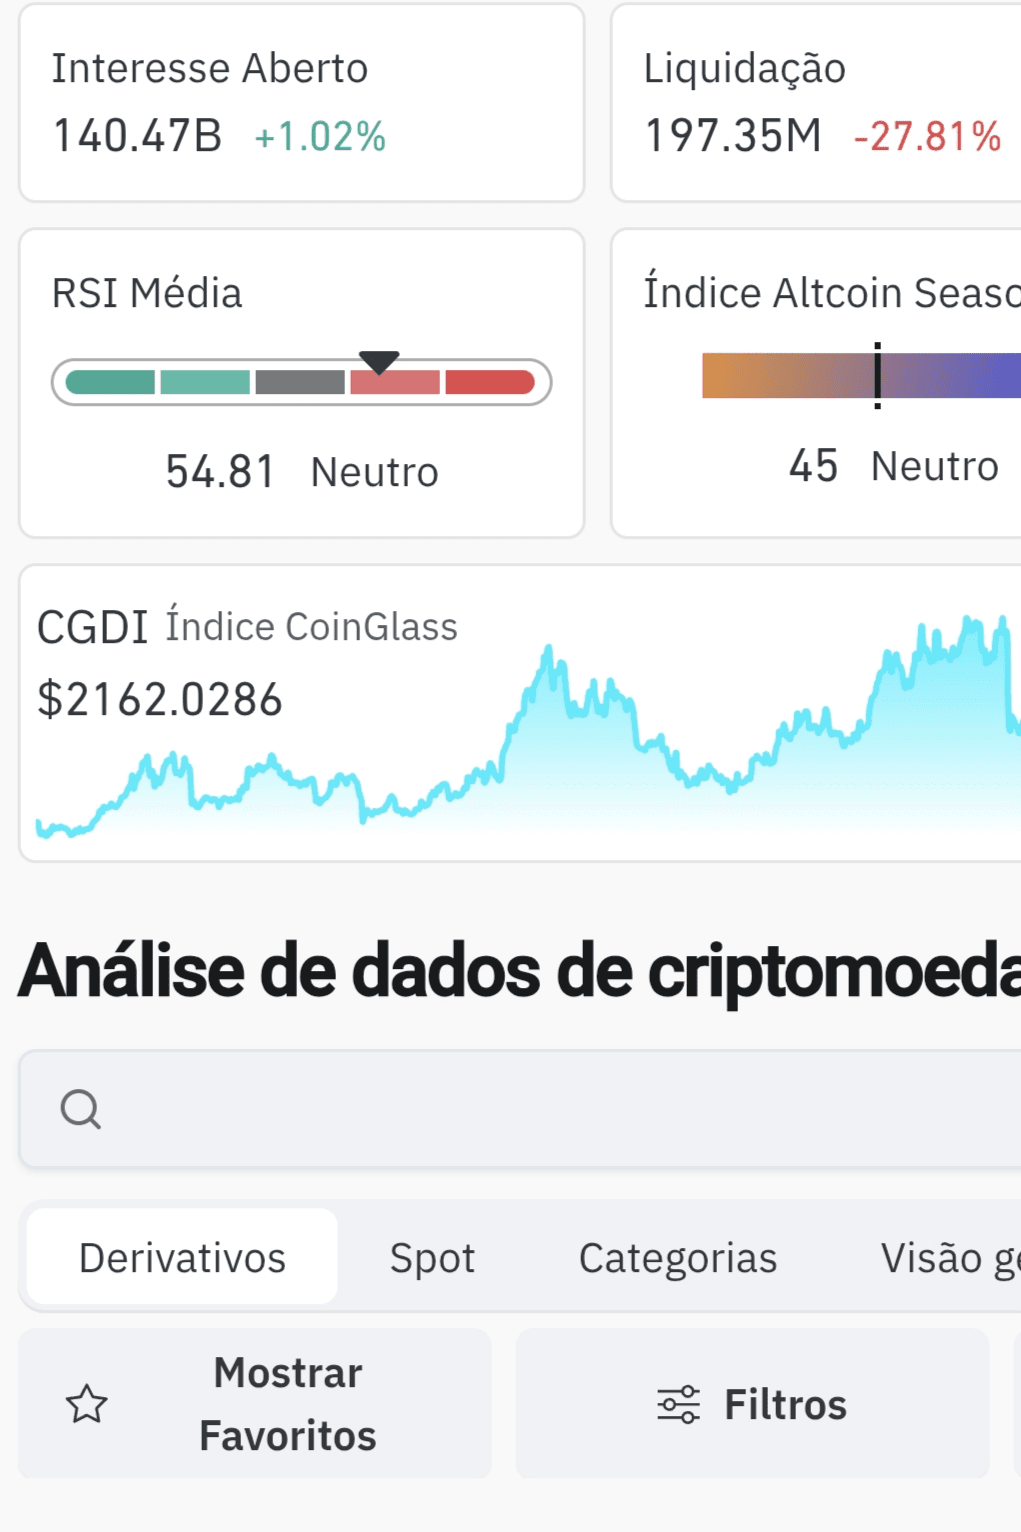
1. Open Interest: The Thermometer of Greed (and Fear)
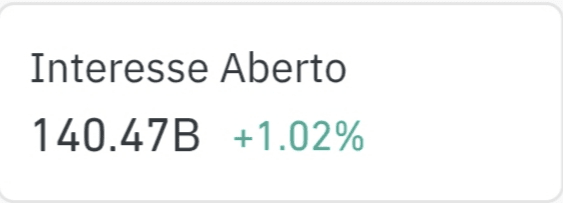
Open Interest is not just a number; it is the sum of all bets still on the table. Imagine that each open futures contract is like us entering the arena. The game is starting.
The Clinical View: When the price of BTC rises and Open Interest follows this increase (a jump of +1.02%, for example), the market is telling us that the movement has "fuel." New traders are coming in and putting money on the table.
The Master Alert: If this number inflates too much, the market becomes "heavy." Many leveraged bettors create a perfect trap for the Long Squeeze — that stretch of pain that forces everyone to sell at the same time, 😭 collapsing the price like a house of cards.
2. Liquidation: The Blood Trail that Clears the Path
In the derivatives market, when someone messes up badly, the brokerage "immediately gives a reprimand: {Are you crazy? Are you going in with x50 with your entire bankroll on FOMO? I'm going to break you right here before you do more stupid things.}" And closes the position. This is liquidation.
The Scenario: A drop of -27.81% in liquidations indicates a moment of technical calm. It's as if the dust of battle has settled.
The Golden Insight: Liquidation spikes often mark the end of a movement. When you see millions being liquidated in minutes, it's usually the market screaming: "The fuel for the shorts (or longs) has run out!" It is in this "blood in the streets" that great reversal opportunities often sprout.
3. Average RSI: The Athlete's Breath
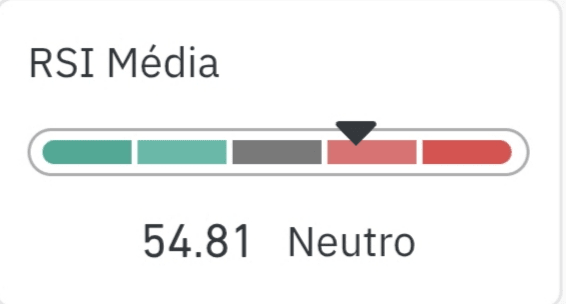
The RSI (Relative Strength Index) works like the lung of Bitcoin. If the price rises nonstop, the RSI enters "overbought" (above 70) — the athlete is exhausted, panting. If it drops too much, it enters "oversold" (below 30) - the athlete took a break, drank some water, and is about to hit the gas. 🏃🏾
The Sweet Spot: Like, at 54.81, BTC is in what we call the neutral zone. Neither euphoric nor in panic. This is magnificent as it indicates that there is room to run in either direction without immediate exhaustion. The engine is warmed up but far from overheating.
4. Altcoin Season: The Game of Capital Chairs
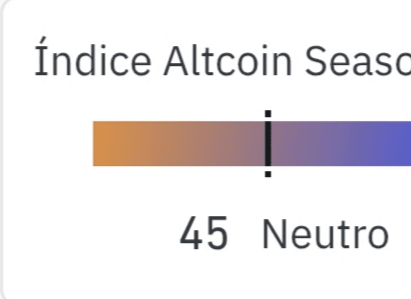
Where is the money going? The Altcoin Season index answers that.
Reading (45): We are in almost neutral territory, but with Bitcoin still holding the reins.
Why does this matter? A healthy Bitcoin usually leads the line. When the index rises to the 75-100 zone, smaller coins (Altcoins) explode, which is fun but historically signals that the BTC cycle may be reaching a temporary peak. While the index is low, Bitcoin is the solid protagonist of the narrative. It is the godfather; this is where the guys with the password ride the wave. 😎
BONUS! Here is where men are separated from boys.
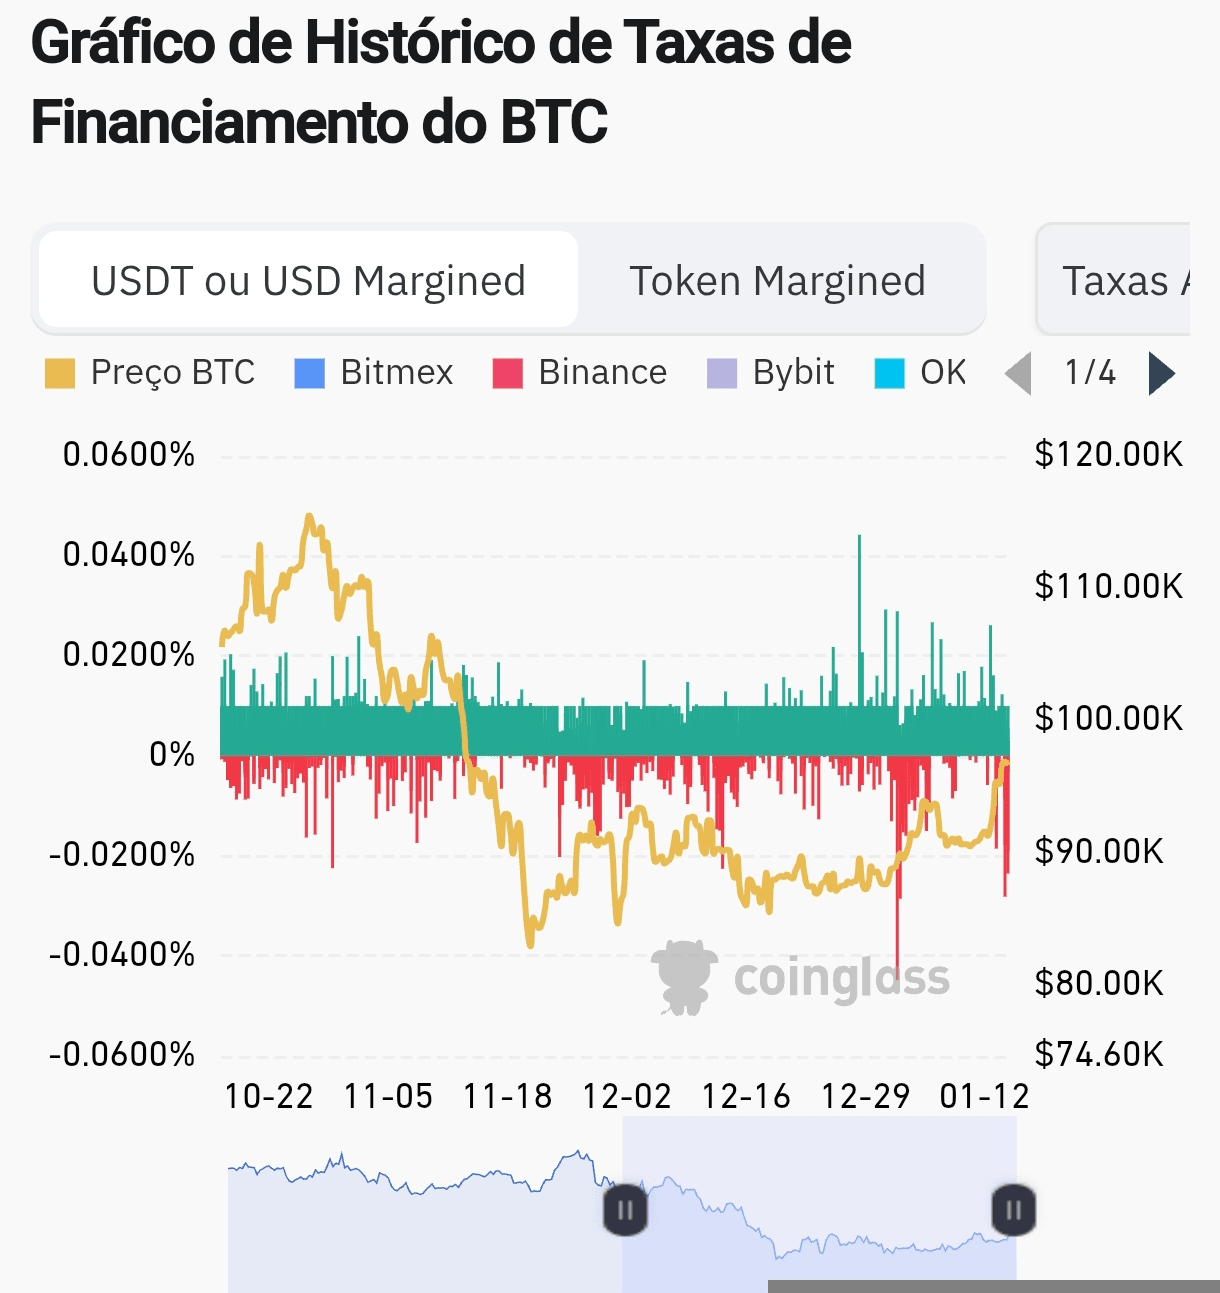
In addition to these four pillars, keep an eye on the Funding Rate. If this rate is very high and positive, the "longs" are paying dearly to maintain their positions. This is a classic sign of excessive euphoria. Balance is the key to a sustainable rise.
Final Considerations
Understanding these indicators separates investors from gamblers. Bitcoin is not just an asset; it is a living organism of data and human psychology. Studying these metrics gives you the X-ray vision needed to not be caught off guard by the next wave.
That's it, troops! If it were easy, everyone would win!
Important note: This content is strictly educational and informative. The analyses presented here do not constitute, under any circumstances, an indication, signal, or investment advice. The cryptocurrency market involves significant risks, and bankroll management is the individual responsibility of each investor.
Did you like this idea?
If this content opened your mind, don’t keep it to yourself! 🚀
Like this so I know you want more analyses like this.
Comment: Which of these indicators do you use the most in your daily life?
Share with that friend who needs to stop just looking at the price and start looking at the data!
.