 Multi-timeframe Technical Analysis
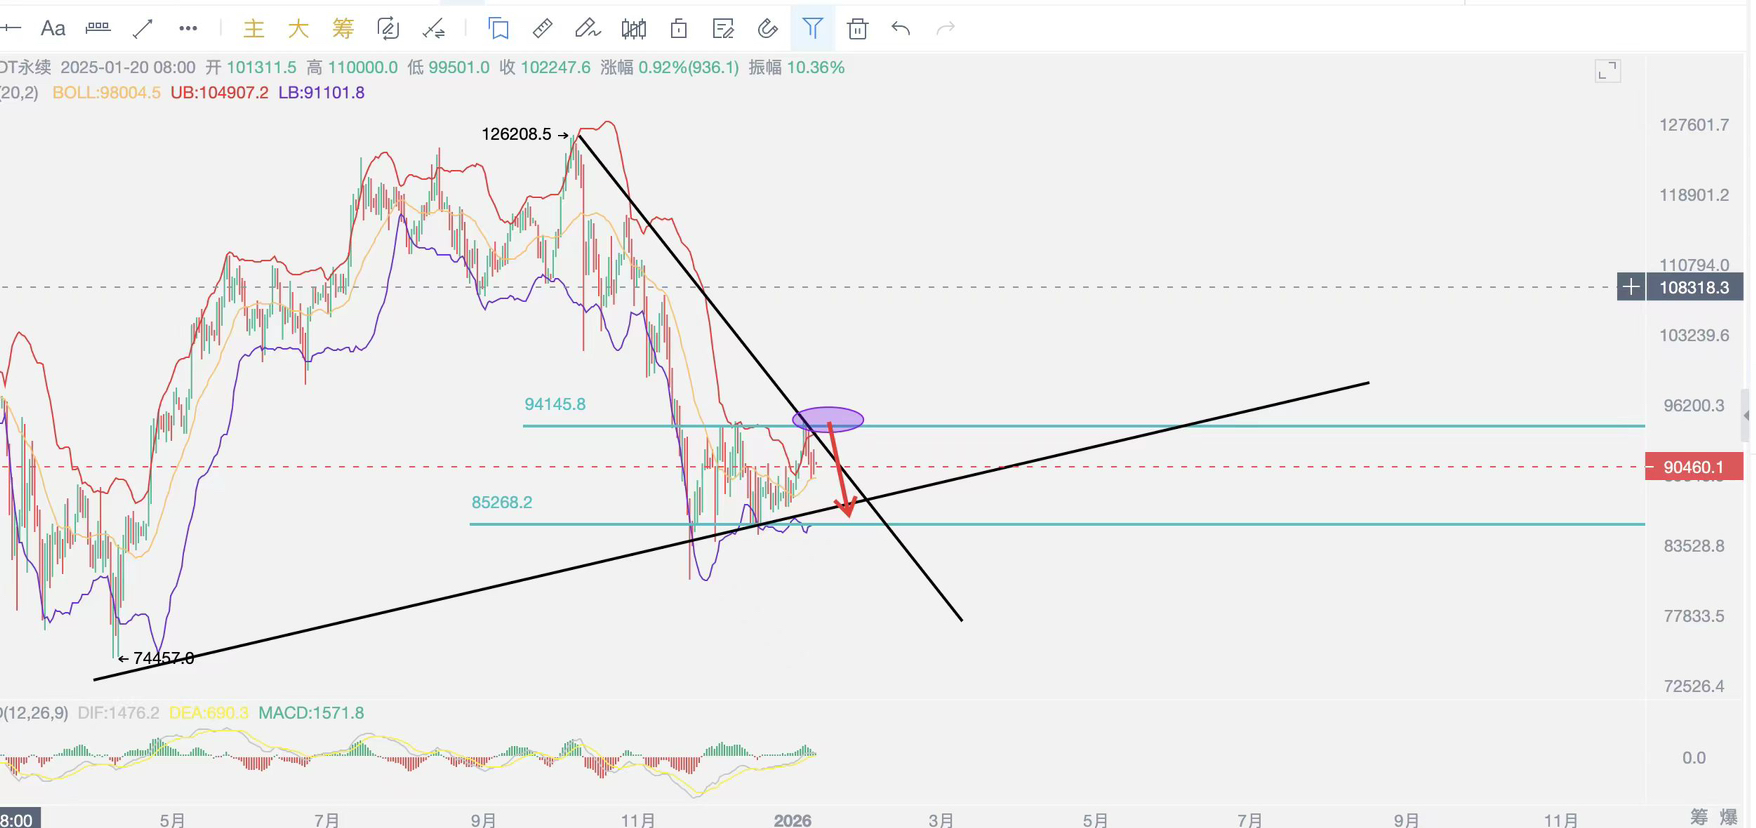
Daily Chart (Long-term Trend - High-level Consolidation Turning Weak) The price is now pressured below the MA20 (around 89,500), and several short-term moving averages are beginning to turn downward, showing early signs of a bearish alignment. This indicates that the medium- and long-term trend has shifted from an uptrend to a high-level consolidation, with a weakening tendency. The strong resistance above is near MA20 and the previous 94k area, while the key support lies at the old platform of 86,000–87,000. Indicators show that MACD and RSI are both lackluster, with evident lack of momentum on the daily timeframe.
4-Hour Chart (Medium-term Trend - Consolidation Downward) This timeframe reveals a clearer picture: after peaking at 94,789 on January 5th, the price has been in a steady decline, forming a descending channel. Currently, the price is struggling near the lower boundary of the channel. MA20 has crossed below MA60, a classic bearish alignment. MACD has been weakening since its death cross below the zero line, and although the red bars (bearish momentum) have shortened slightly, they are far from turning strong. Key resistance lies at 91,500–92,000 (channel upper boundary and previous minor support), with support at 89,000 (recent low) and 86,000.
1-hour chart (short-term trend - weak rebound under pressure) There was a rapid surge late last night, pulling up directly from around 90,000 to 91,700+, but it was obviously a 'one-night stand' market, quickly falling back down. The price is now hovering in the small range of 90,500-90,800. The moving average system on the 1-hour level (MA5, MA10, MA20) has already fused and started to diverge downward, the MACD has formed a death cross below the zero axis again, and the RSI is in the weak area below 50. This indicates that the short-term rebound momentum has been exhausted, and the bears have regained control.
15-minute chart (ultra-short term - looking for direction) This is a typical 'chicken rib' market, with decreasing volatility and shrinking trading volume. Prices are compressed between 90,300 and 90,800, oscillating in a narrow range. This kind of trend is often a precursor to a trend change, combined with the weakness of the larger cycle, the probability of a downward breakthrough is greater.
The 'Ice and Fire' of news and on-chain data
The news front is very interesting now, presenting a state of 'intertwined longs and shorts, but the chill is deeper': The bearish pressure is obvious:
Overall market cooling: In December, trading volumes for spot and derivatives on exchanges plummeted, with on-chain derivatives shrinking by 30%, indicating a retreat in market participation enthusiasm.
Capital outflow: Bitcoin spot ETF has recently seen continuous capital outflows, with a total outflow of $1.128 billion since January 6, which represents real selling pressure.
Miner pressure: The current price (around 90,500) has fallen below the miners' 'growth cost line' (around 95,000-96,000), and although it does not lead to a complete network collapse, it will suppress miners' willingness to sell and limit the investment of new computing power, which is a medium to long-term concern.
Sentiment is low: The Fear and Greed Index is only 25, indicating 'extreme fear', and market confidence is weak. Potential positives and support:
Whale accumulation: The number of addresses holding more than 100 BTC has reached an all-time high, indicating that 'smart money' is quietly accumulating during the consolidation period, which is an important bottom support signal.
Institutional layout: Top venture capital firms like a16z are raising large amounts of capital, heavily investing in AI and cryptocurrency; Nasdaq and CME have teamed up to launch cryptocurrency indices, paving the way for future institutional entry.
Regulatory progress: News such as Ripple obtaining FCA licenses in the UK is a long-term positive for the compliance process.
Comprehensive prediction and trading ideas
By combining technical and news perspectives, the conclusion becomes clearer: The market is in a 'high-level consolidation period after the end of a medium to long-term uptrend', and the short-term focus is gradually shifting downward. The accumulation behavior of whales acts like a 'ballast', preventing panic selling, but the outflow of active funds (ETF outflows, declining trading volume) and the cost pressure on miners leave the price lacking the fuel for an upward breakthrough.
Therefore, our prediction is: In the short term (the next 1-3 days), it leans towards a downward oscillation to test the core support area of 86,000-87,000. In the medium term (1-2 weeks), whether it can stabilize depends on the outcome of the long-short game at that position.
Trading idea (for reference only, strict risk control):
Main idea (high altitude): When the price rebounds to the 91,000-91,500 area, consider lightly positioning short orders, with a stop loss set above 92,200. The first target looks at 89,000, and the second target looks at 87,000.
Secondary idea (low long observation): If the price directly drops to the 86,000-87,000 area, don't rush to catch the bottom. Observe whether there is a clear stop-loss candlestick pattern (such as long lower shadows, bullish engulfing), and if the MACD on the 1-hour or 4-hour chart shows a bottom divergence, then consider a small position for a rebound, with a stop loss placed below 85,500. The rebound target should first look at 89,000.
Key reminder: At this current position near 90,500, the space above and below is unclear, and it is important to avoid chasing highs and selling lows. Be patient and wait for the price to reach a key position before taking action.