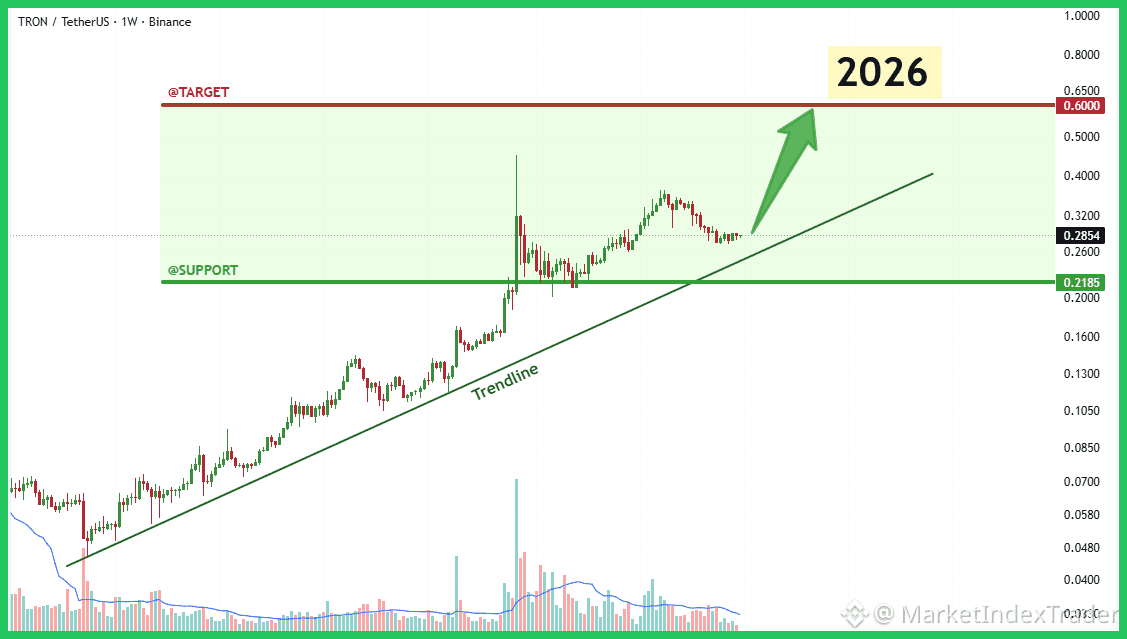
The weekly chart for $TRX shows amazing strength, successfully maintaining an upward trend line for several years. The rejection at the support of $0.2185 indicates a bullish continuation towards $0.6000.
Alright team, let's break down this delicious TRX chart and see what's happening. The long-term outlook for TRON looks incredibly strong, and the weekly candles confirm that institutional interest is far from over.
Technical analysis
On the 1W chart, $TRX/USDT strictly respects the long-term trend line, bouncing strongly after testing the critical horizontal support zone around $0.2185. This decisive rebound confirms that bulls are entering strongly at current levels ($0.2854). If this momentum continues, we clearly target the main resistance and previous upside expectations at $0.6000 by 2026, representing massive upside potential. Maintaining the stable trend line is crucial for this sustained bullish thesis.
Core strength
Essentially, TRON continues to impress. The network boasts massive total value locked (TVL) figures and remains a dominant force in stablecoin trading, directly competing with major chains in terms of daily transaction volume due to its high speed and low fees. Recent metrics show steady growth in active addresses and DeFi participation, providing strong support for the technical breakout.
Action plan
My strategy here is simple: accumulate $TRX on dips near the trend line or support zone. This is a powerful long-term game aiming for a $0.60 target. A weekly close below $0.2185 would require re-evaluating the bullish outlook.
I strongly recommend holding and stacking $TRX on Binance
Feel free to comment the altcoin you're holding and we'll check it for you!
#TRX #TechnicalAnalysis #Crypto #BinanceSquare #TRON #Altcoins #Bitcoin