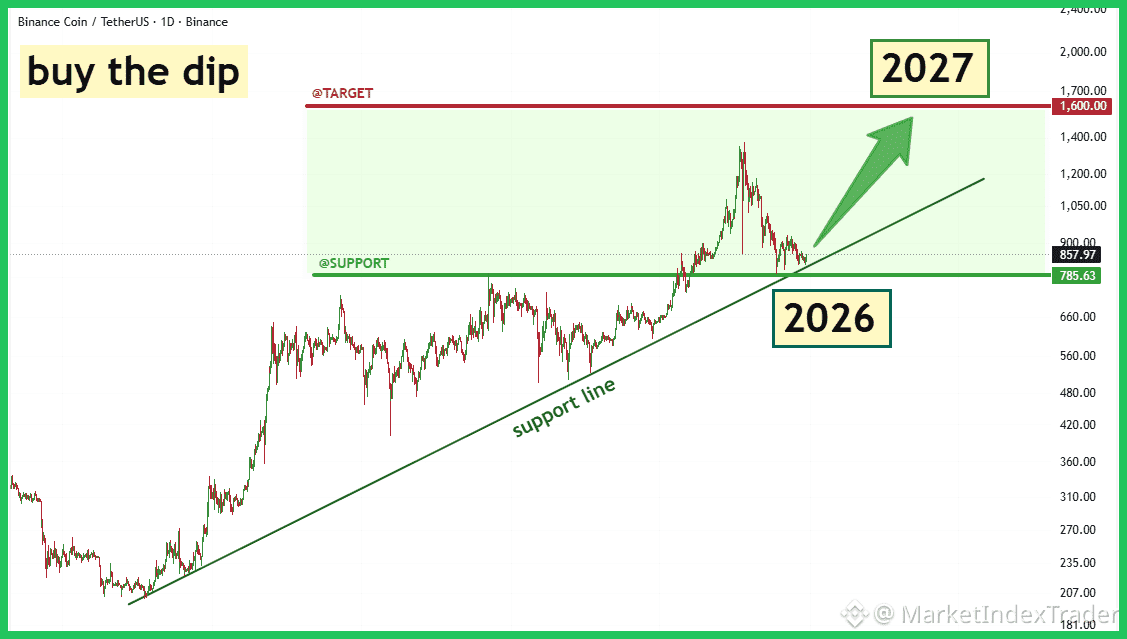
The BNB/USDT daily chart shows a typical retest of the long-term ascending trendline support, along with a critical historical resistance that turned into support around the $785 - $830 area. This is a crucial accumulation zone.
Alright team, let's break down this delicious BNB chart and see what's going on. The recent correction after the major movement gave us a perfect entry opportunity for "buying the dip."
Technical Analysis
When looking at the one-day chart, it retraced $BNB perfectly to the intersection of two key support levels. The long-term upward trend line has been tested, coinciding with the critical horizontal support area between $785 and $830. The current price action (around $857) indicates strong buying interest entering the market here. Maintaining this area is crucial for the continuation of the overall upward trend. Our main long-term target, based on structural expansion, remains at the level of $1,600.
Core fundamentals
From a fundamental perspective, $BNB continues to benefit significantly from the ongoing flow of high-quality projects launching on Binance Launchpool and Launchpad, which enhances the ongoing demand for the use and storage of the currency. Furthermore, the scheduled quarterly token burns ensure a sustainable contraction mechanism, structurally reducing supply and supporting long-term value.
Action Plan
This area is highly favorable for Dollar Cost Averaging (DCA) and establishing core positions. Accumulate near the trend line support. A confirmed daily close above the $900 mark will be the immediate catalyst indicating that the correction has ended and the next major move has begun.
Strongly recommended to hold and stack $BNB on Binance
Feel free to comment on the altcoin you hold and we will check it for you!
#BNB #BinanceSquare #Technical_Analysis #Cryptocurrency #Buy_the_Dip #Altcoins