Looking at the screen with that single liquidation record of 14.14 million dollars, I stared at the one-hour candlestick chart of BTC, feeling a chill down my spine—this is not the end, merely the first page of a bloody prologue.
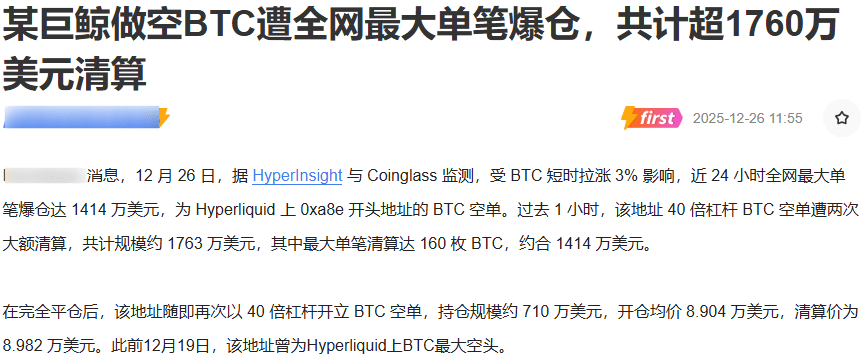
A message shook the entire cryptocurrency world: a certain whale's short position was continuously liquidated with 40x leverage during a 3% short-term rise in BTC, totaling over 17.6 million dollars.
What is most intriguing is that after the liquidation, this address showed almost no hesitation and immediately opened a new short position of 7.1 million dollars with 40x leverage. This 'gambler-like' operation reminds me of similar scenes on the eve of last year's crash.
The underlying conflicts behind the news
The market opens at four o'clock this afternoon, and at this time, that whale address starting with Oxa8e may be confidently increasing its short positions.
In just one hour, the market dealt him a heavy blow. 160 BTC, worth 14.14 million USD, was liquidated all at once. This is not an ordinary stop-loss exit; this was swept away by the market.
When I checked the data on the Hyperliquid platform, I found that this address had already been the largest short position for BTC on the platform since December 19. A week of perseverance has resulted in today's bloody lesson.
But what really makes me vigilant is not the liquidation itself, but the choice made after the liquidation—immediately reopening short positions. This is reminiscent of a gambler in a casino who bets everything to 'break even'. This kind of sentiment is often a precursor to a bigger market reversal.
The news is full of tension! The whale liquidation shows the weakness of the shorts, and the delivery history suggests a high probability of 'first suppression, then rise'. If you're unclear about the specific timing, you can find Nanxi, who reminds friends who have followed me in real-time for 24 hours.
The struggle between bulls and bears in the candlestick chart
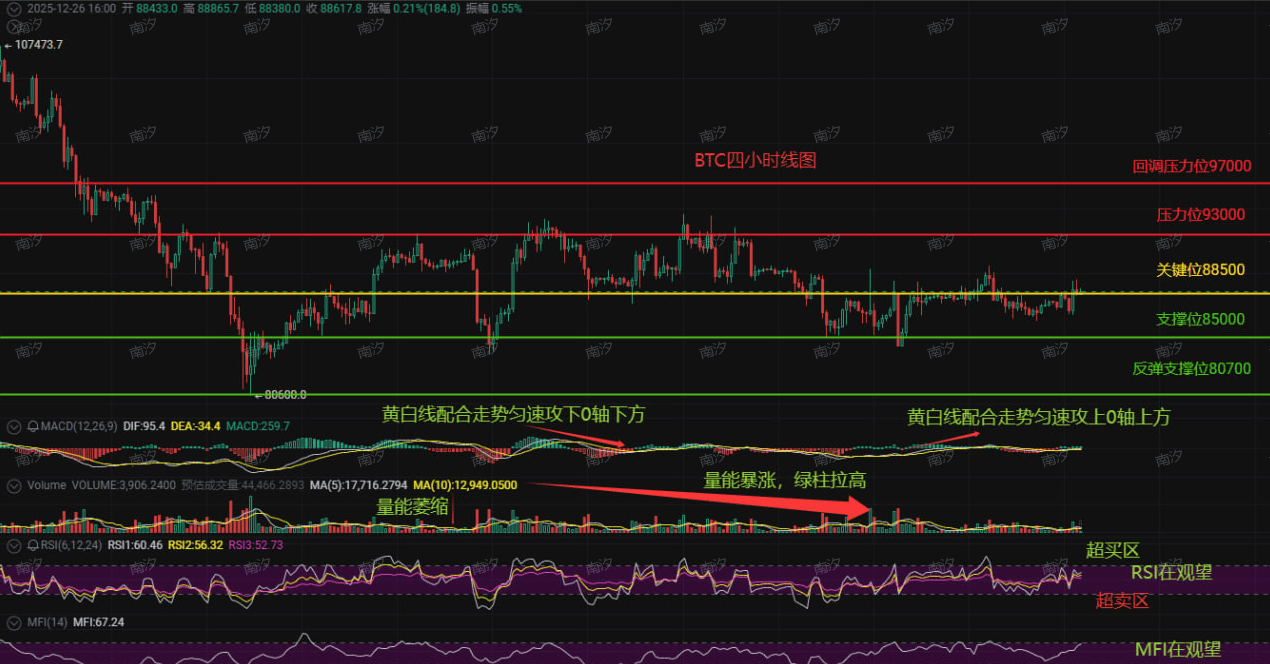
Switching to the 4-hour candlestick chart, the technical indicators tell another version of the story. Although the overall trend remains downward, the MACD's yellow and white lines have firmly stood above the 0 axis.
This is a subtle signal. Typically, a MACD crossover above the 0 axis indicates a strengthening of short-term momentum, but in a downward trend, it might just be a dead cat bounce.
Carefully observe the key positions: the upper resistance at 93000 and 97000 is like two mountains pressing down, while the lower support at 88500-85000 forms the first line of defense, and 80700 may be the final bottom that this wave of decline could reach.
The volume suddenly surged, and the green bars significantly increased, indicating that funds are fiercely contending at this position. However, the RSI and MFI are still hovering in the observation area, and this divergence makes me hesitant to have high expectations for a rebound.
What worries me most is the liquidation price of that newly opened short position by the whale—89820 USD. This position happens to fall within the critical resistance zone between 88500 and 93000. Will the market deliberately blow up this position before turning?
Looking at the market and the news, I am reminded of a similar scene in September 2023. At that time, the market also reversed suddenly after whale liquidations, burying countless retail traders who shorted.
Will history repeat itself this time? My judgment is: in the short term, it may test the resistance at 93000, but the medium term still looks bearish.
Why? Because that whale is not fighting alone. It represents a kind of stubborn bearish thinking; as long as this thinking is not completely convinced by the market, the downward trend will be hard to truly end.
But the market is best at slapping consensus in the face. When everyone thinks it will drop to 80700, it might only drop to 85000 before turning upwards; when the shorts are all hanging orders at 93000, it might directly surge to 97000 and clear them all.

Nanxi's steady advice for players:
Leverage is dangerous; don't follow the big players. A rebound to around 93000 can be shorted with a small position, and a stop-loss must be set if it goes above 97000. For the decline, first look at 88000 to 85000, and be quick to seize the rebound here; set a stop-loss and don't be greedy. If it breaks below 85000, the next target is around 80000. Be careful of the market specifically hunting for follow-up positions.
On the four-hour chart, the yellow and white lines are steadily attacking above the 0 axis, but the pressure zone above remains as heavy as iron. Nanxi will continue to closely monitor changes in the market, especially whether the volume continues to cooperate.
Find Nanxi, and I will issue a warning in advance at the next critical turning point. After all, in this market, it is not the bravest or the smartest who survive, but those who understand 'going with the trend' and 'stop-loss'.
When most people only see the resistance at 93000 and the support at 80700, I am already observing another hidden factor that could trigger a market explosion—but this story is for the fans who find Nanxi.
Want to know the specific points to enter the market and where to set the stop-loss most safely? Nanxi has already provided reminders in the village; those who want to follow can become Nanxi villagers!#BTC走势分析 $BTC
