
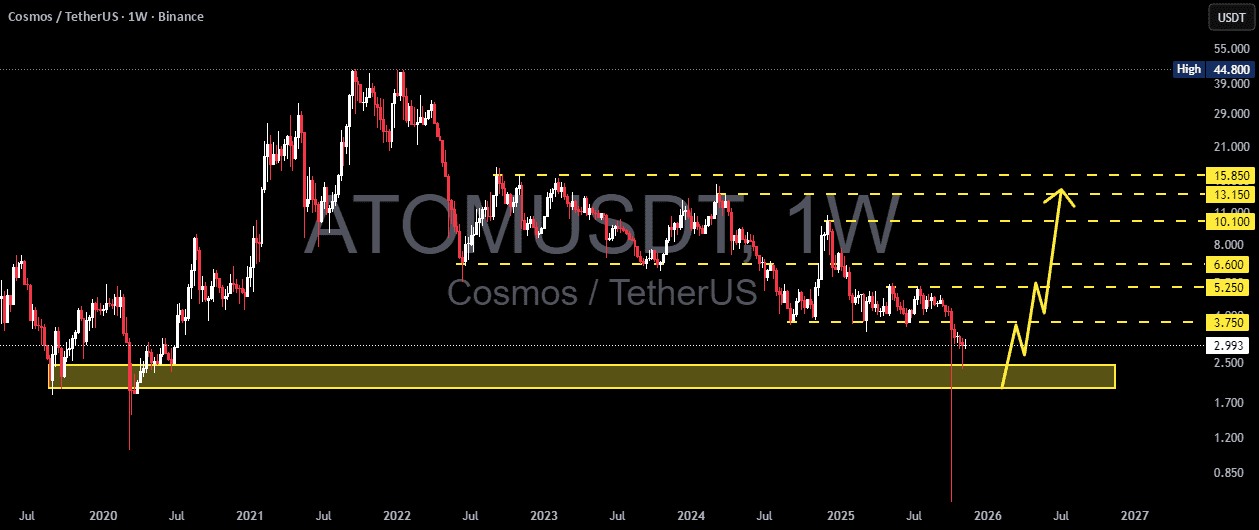
 Cosmos (ATOM) is now at a very critical point in recent years, specifically within the historical support zone of 2.45–1.95, which has served as a major accumulation area since the early phase of the market rise in 2020. This area is not just a number - it represents the psychological foundation of the ATOM market.
In recent weeks, the weekly chart has shown a sharp decline followed by a long lower wick, indicating a significant liquidity withdrawal. In other words, many long positions were liquidated before the price was pulled up - suggesting that smart money may be accumulating here, despite no confirmed reversal so far.
Technically, ATOM is still in a medium to long-term downtrend, forming a series of lower highs and lower lows since 2022. However, the current level opens up two main possibilities - the beginning of a new accumulation phase, or the continuation of the final capitulation wave.
---
Pattern structure and technical context
1. The main trend: the multi-year bearish trend remains intact.
2. The golden zone (historical support): 2.45–1.95 - the same accumulation area that fueled the market rally in 2021.
3. Liquidity trapping and withdrawal: the long wick below the area shows liquidity accumulation, a potential reversal signal if confirmed by a bullish weekly candle.
4. Confirmation of reversal: requires a weekly close above 3.75, followed by a successful test.
5. Volume and divergence: watch for bullish divergence on RSI or MACD to strengthen the reversal.
---
Bullish scenario - "Birth Zone"
If the price holds strong above the 2.45–1.95 area, this may represent the beginning of a major re-accumulation phase. The bullish case strengthens if:
A weekly close above 3.75 occurred (restoring old structural support).
The move was supported by strong volume and a solid bullish candle.
Formation of a higher low above 2.45.
Target levels step by step:
➡️ 3.75 → 5.25 → 6.60 → 10.10 → 13.15 → 15.85
If the momentum continues, a Adam and Eve reversal or an inverted head and shoulders may form in this area, indicating a transition from a bearish market to a new bullish trend.
The core bullish idea: the 2.45–1.95 area is the "point of life or death" - holding above it provides a high-risk reward setup compared to the downside risks.
---
Bearish scenario - "Ground Break"
However, if a weekly close occurs below 1.95, this historical support will officially be invalidated.
This may lead to:
A final capitulation wave towards 1.20 or even 0.85, levels that previously served as a base before the market rally in 2020.
Failed test of the 2.45–1.95 area (turning it into resistance).
Market sentiment declines, pushing ATOM into a long bearish continuity phase.
In this case, traders should wait for a confirmed bottom to appear before accumulating, as the downside risks remain open.
---
Conclusion
ATOM is now in the final battleground between buyers and sellers.
If the 2.45–1.95 area holds, we may see the early stages of a major ATOM recovery, heading towards the 5–10 USD range. But if it breaks, the long-term bullish structure officially collapses, and the market may seek to balance at a significantly lower level.
The coming weeks will determine whether this area will become the foundation for a new birth, or a gateway to a deeper decline.
---
#ATOMUSDT #Cosmos #CryptoAnalysis #WeeklyChart #SupportZone #Market_Structure #Trade_Movements #Bullish_Reversal #Bearish_Break #View_Trade_Analysis #Technical_Analysis
✅ Trade here on $ATOM