
We predict price movement. Also, why everyone is shouting that Bitcoin will fall, the bear market has started, etc. We will analyze from the perspective of trends. 👇👇👇
So, identifying and building trends is a fundamental and very powerful tool of technical analysis.
Binance has a very convenient tool called Parallel Channel. We will test it on the BTC chart.
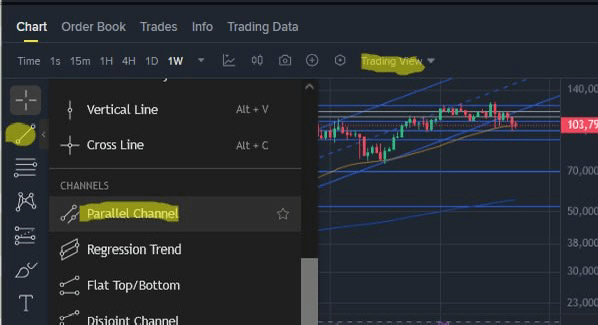
Let's move to the Trading View tab. On the left side of the toolbar, select Parallel Channel. Connect the lows on the weekly chart with a line (the trend is long, so we take a large timeframe to see the whole picture). The second line is automatically drawn parallel to the first. We extend it so that it constrains the highs. That's it, the trend channel is ready.
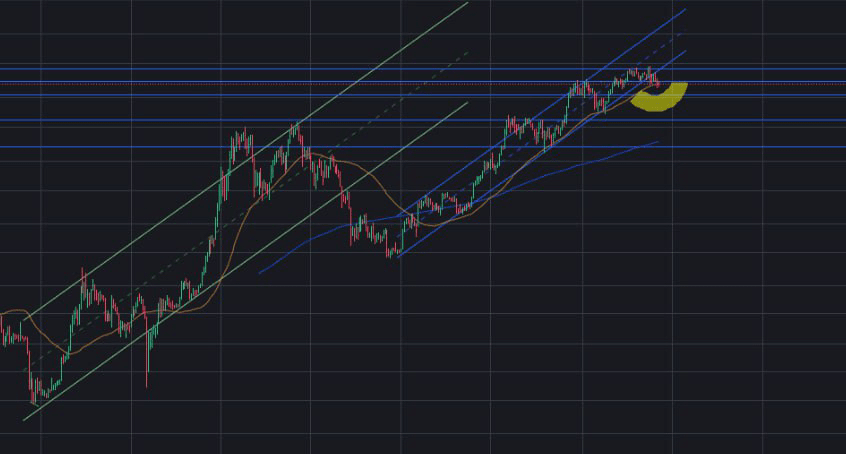
Two parallel lines serve as inclined support and resistance. As we can see, they constrained the price for a full three years. Those who built the channel after the first waves in 22-23 years could successfully predict the BTC price all this time.
The tool is very convenient. Channels can be constructed for short-term trends (on 1h, 4h, 1d) to predict price reversals. If the price touches the edge of the channel, a reversal is likely. If the price breaks the ascending channel downwards, this trend is likely over.
Let's return to Bitcoin. Right now we have this situation - the ascending channel has been broken downwards 😭. Moreover, there has already been a retest: the price returned to the channel from below and bounced back. Now the channel acts as resistance.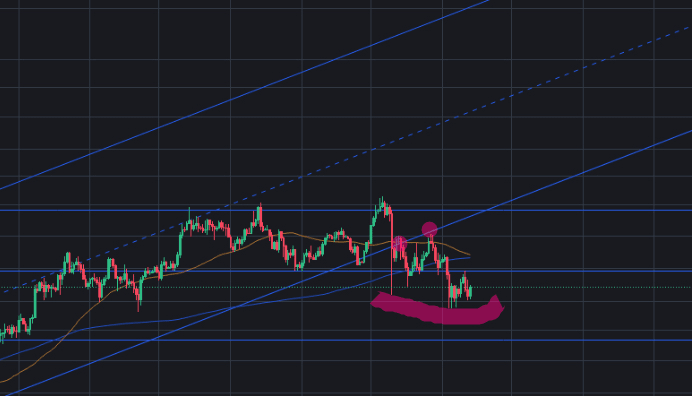
And here’s what else: the average age of long-term trends is 3 years. The age of the ascending $BTC trend is 3 years. Is that all? 😭 Another argument for the bears.
I am not removing the main trend channel from the chart yet. If there is another movement upwards, it will work again as resistance and stop the price. Another option is that the price will return to it 😍, then the trend will continue.
Do you draw trend channels? If not, I highly recommend starting 👇


