The Liquidation Map is a visual tool displaying the liquidation zones (liquidation levels) of the futures market on exchanges, compiled by the Coinglass platform. It helps traders see where high-leverage Long/Short orders are concentrated, thus predicting areas where prices are prone to 'liquidation sweeps' – a common phenomenon in crypto.
🔍 How it works:
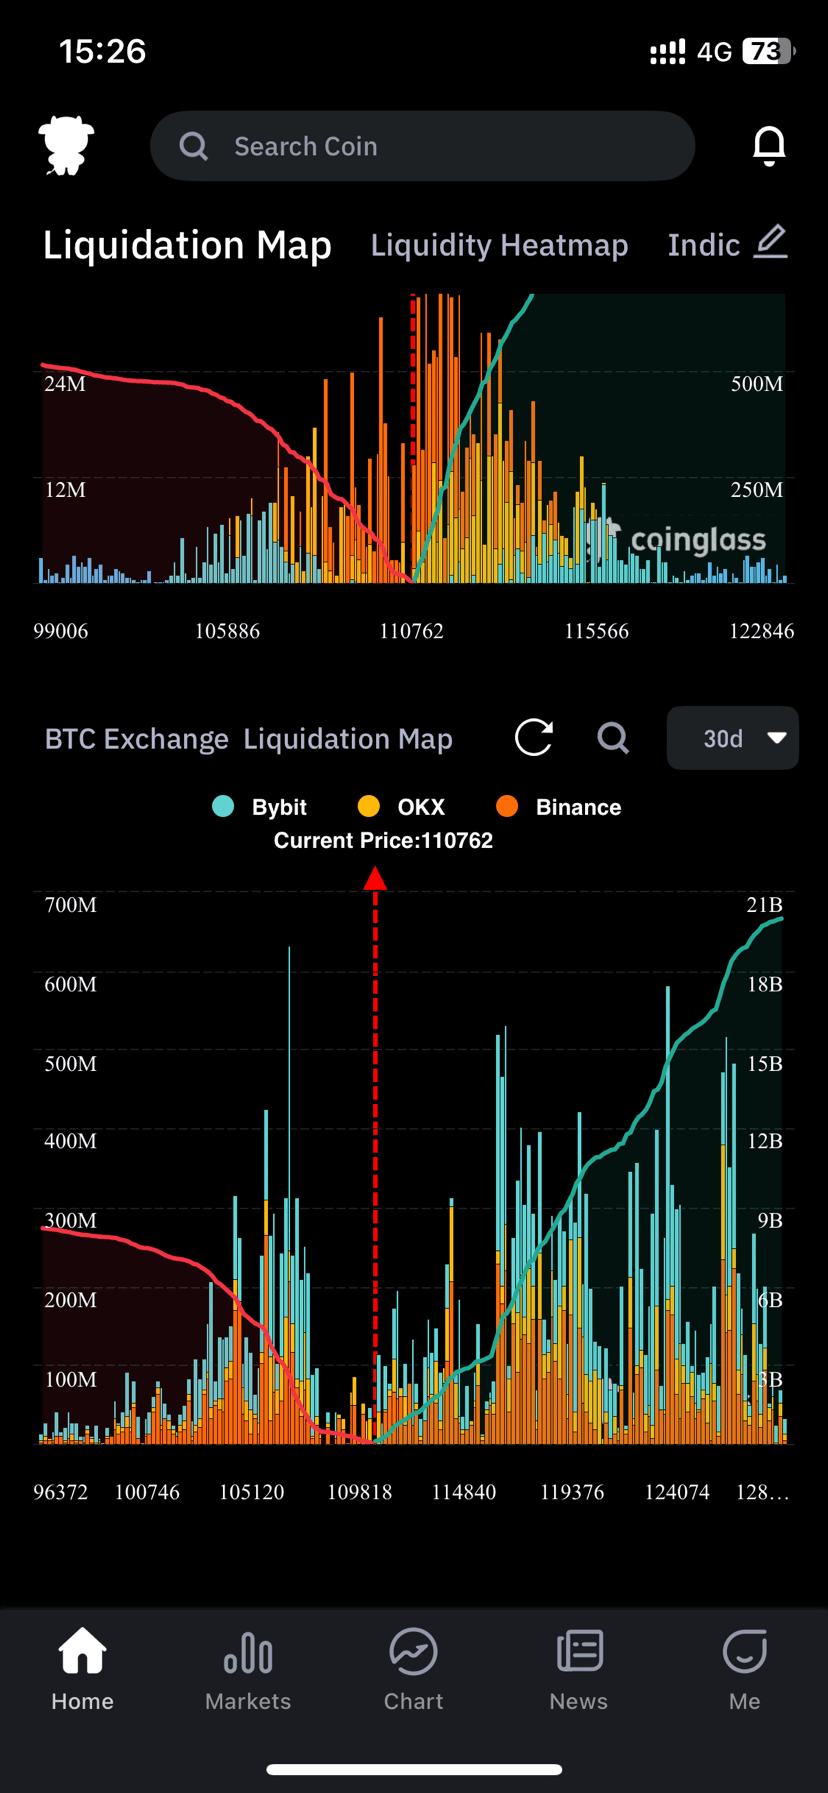
When a trader opens a leveraged position (for example, Long BTC at 70,000 USD with 10x), if the price drops by about 10%, it will be liquidated. Coinglass collects data from major exchanges and displays the liquidation density by price in the form of a heatmap.
Dark areas (red/orange): Many Long/Short orders concentrated → easily become targets for sharks.
Light or faint areas: Few liquidations, the market is less volatile.
📈 How to read signals:
When the price approaches an area with a dense Long liquidation (below) → the price is likely to be 'pushed down to sweep Long' and then rebound.
When the price approaches an area with a dense Short liquidation (above) → it is easy to be 'pushed up to sweep Short' and then reverse down.
If liquidation clusters are concentrated on both sides of the current price, the market is sideways and prone to a 'fakeout' to clear liquidity.
⚙️ Practical application:
Identify high-risk areas: Avoid placing orders near areas with many liquidations.
Set reasonable stop-loss: Do not let the stop coincide with concentrated liquidation areas as it is easy to get 'swept' out of the position.
Monitor shark behavior: When large liquidation areas are swept, the market often changes direction sharply.
⚠️ Note for newcomers:
The Liquidation Map is not an absolute price prediction tool, but rather a map of leveraged market psychology. It should be combined with other trend indicators like MA, MACD, or Volume for confirmation. Additionally, this indicator has a slight delay due to aggregating data from multiple exchanges.
In summary:
The Liquidation Map helps traders see the market's 'weak points' — where leveraged money is easily liquidated. By understanding how to read this map, you can go with the big money instead of getting caught in liquidity sweeps, thus enhancing your survival chances in the highly volatile crypto market.
#BinanceSquare #writetoearn #CryptoAnalysis #trading #BTC走势分析 $BTC