(1D) chart analysis for ZEROBASE $ZBT
April 1, 2026,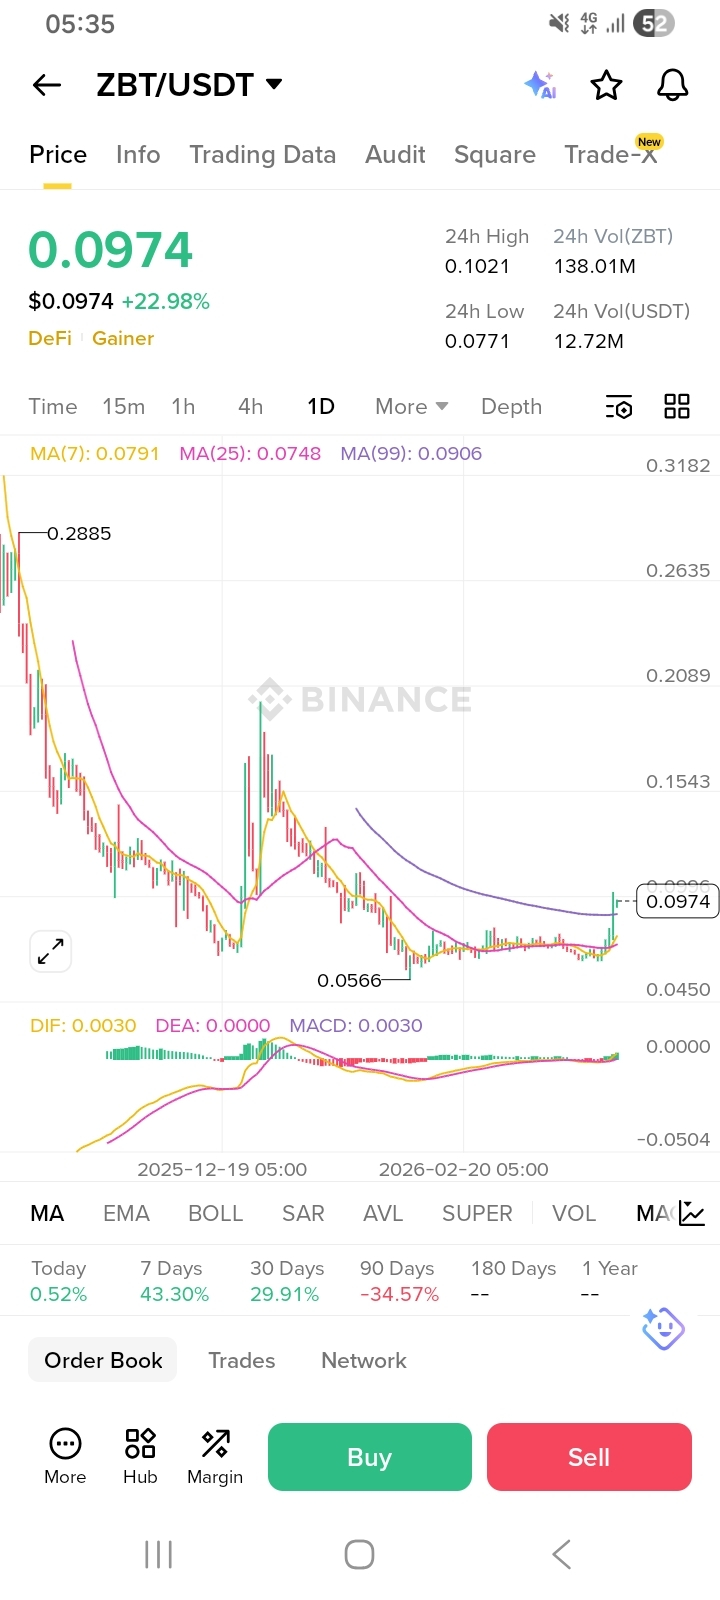 the token is currently showing signs of a short-term recovery following a period of bearish pressure.
Technical Overview (1D Chart)
Current Price: Approximately $0.0828, up nearly 11% in the last 24 hours.
Trend: While the long-term trend (200-day MA) remains sloped downward, the short-term price action is turning bullish, reclaiming levels lost in late March.
RSI (Relative Strength Index): Currently in the neutral-to-bullish zone. It has bounced from oversold conditions, suggesting that the "bottoming out" phase may be complete for now.
MACD: A bullish crossover is forming on the daily timeframe, with the MACD line moving above the signal line, typically a signal for increasing upward momentum.
Trading Sentiment & Setup
Trading Sentiment & Setup
The market sentiment has shifted to "Strong Buy" on several exchange barometers (like KuCoin and Binance Square) due to the 17% gain over the last 7 days.
Bullish Scenario: If ZBT holds above $0.080, it will likely challenge the $0.094 mark. Volume is increasing, which supports this move.
Bearish Scenario: Failure to break $0.085 could result in a "bull trap," leading to a retest of the $0.075 support.
Note: The typical hold time for ZBT investors currently averages around 6 days, indicating high volatility and a preference for swing trading over long-term holding at these levels.