The last hours on the #Ethereum chart have left us with one of the clearest reversal structures of the week. After a deep liquidity sweep, the market has reacted strongly. We break down the current price action and the key levels to watch for the next session.
📊 Structure Analysis (Chart 1H):
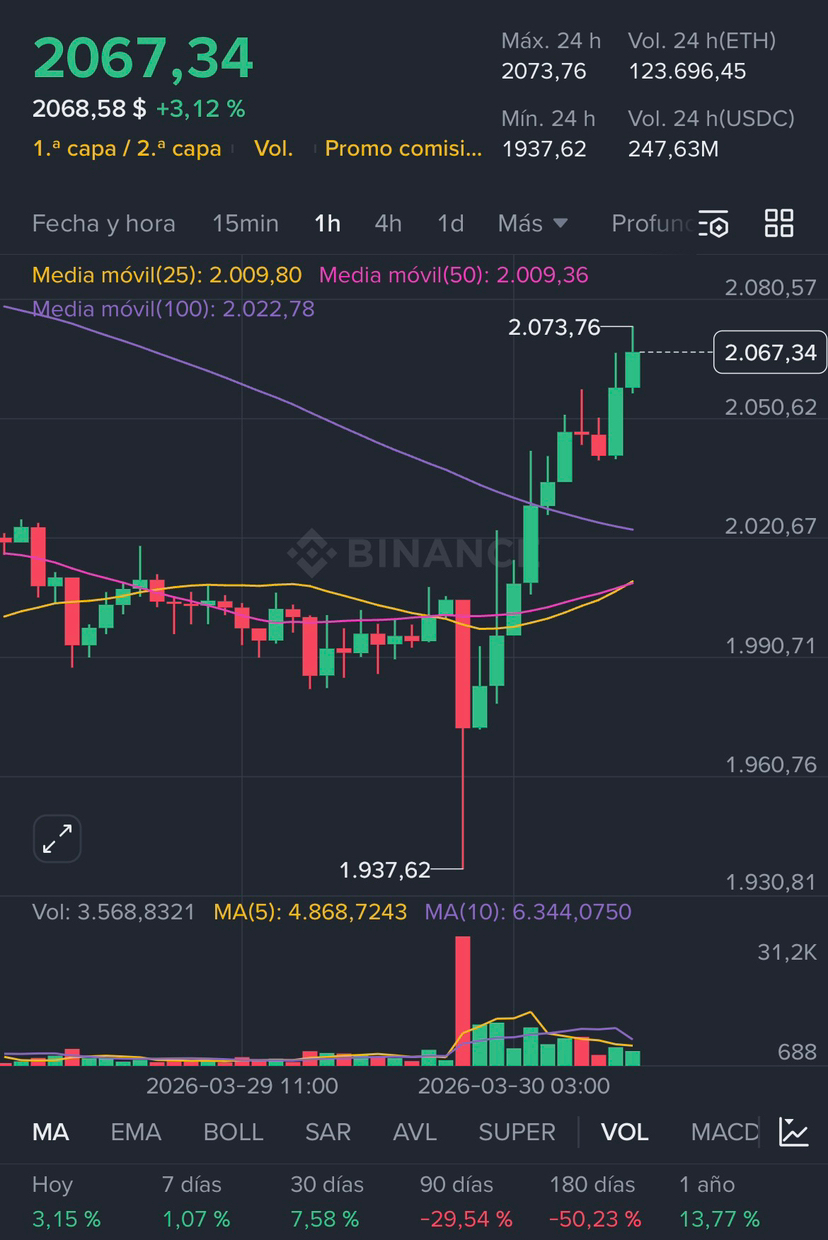
• 1. Liquidity Sweep (Shakeout): The drop to the low of $1,937.62 was a classic capitulation event. If we look at the volume profile at the bottom, that red candle left the highest peak of the session. This indicates strong absorption by smart money (institutional buying) that took advantage of retail panic and Stop Losses triggering.
• 2. "V" Recovery and Break of MAs: The most relevant aspect is not the fall, but the reaction. The price has robustly recovered the zone of $2,000 and has simultaneously pierced the three key moving averages: MA(25), MA(50), and MA(100).
• 3. Change of Polarity: The MA(100), located at $2,022.78 (purple line), acted as dynamic resistance. Crossing it with bullish volume changes the short-term bias from bearish to bullish.
🎯 Operational Scenarios (What to expect now):
Currently trading in the zone of $2,067, ETH is testing the resistance of the 24-hour high ($2,073.76).
• 🟢 Bullish Proposal (Long): If the price manages to break and consolidate above $2,074, the path is clear to seek the next liquidity zones at the upper end. For the more conservative, a pullback to the zone of $2,022 - $2,010 (former resistances, now supports) would offer an excellent risk/reward ratio to join the bullish movement.
• 🔴 Bearish Proposal (Short / Invalidity): A strong rejection at the current resistance ($2,073) with decreasing buying volume could indicate a time range. The current bullish scenario is invalidated if the price loses the psychological support of $2,000 and closes 1H candles below this level.
💡 Conclusion:
The market has shown that there is aggressive demand below $2,000. Trading in favor of the trend after such absorptions usually has high probabilities of success, as long as risk is managed properly during pullbacks.
👇 I open the debate to the community: Do you see a feasible direct breakout of $2,073 in the next few hours or will you wait for a pullback to $2,020 to enter? Share your trades in the comments.
⚠️ Disclaimer: This analysis is a technical perspective for educational purposes and does not constitute financial advice. Always use Stop Loss (SL) and manage your risk.
#ETH #Ethereum #PriceAction #TradingSetup #TechnicalAnalysis #CryptoTrading #SmartMoney #BinanceSquare #Write2Earn #Markets