
Brothers, good morning! The current market is simply thrilling! The current price of Bitcoin is oscillating violently around 67,230. Without further ado, let's directly dissect the main force's extremely bloody washout method! #BTC $BTC Click to join the Flying Fish Strategy Chat Room

Latest Situation Deep Review (Directly Striking the Main Force's Bottom Card):
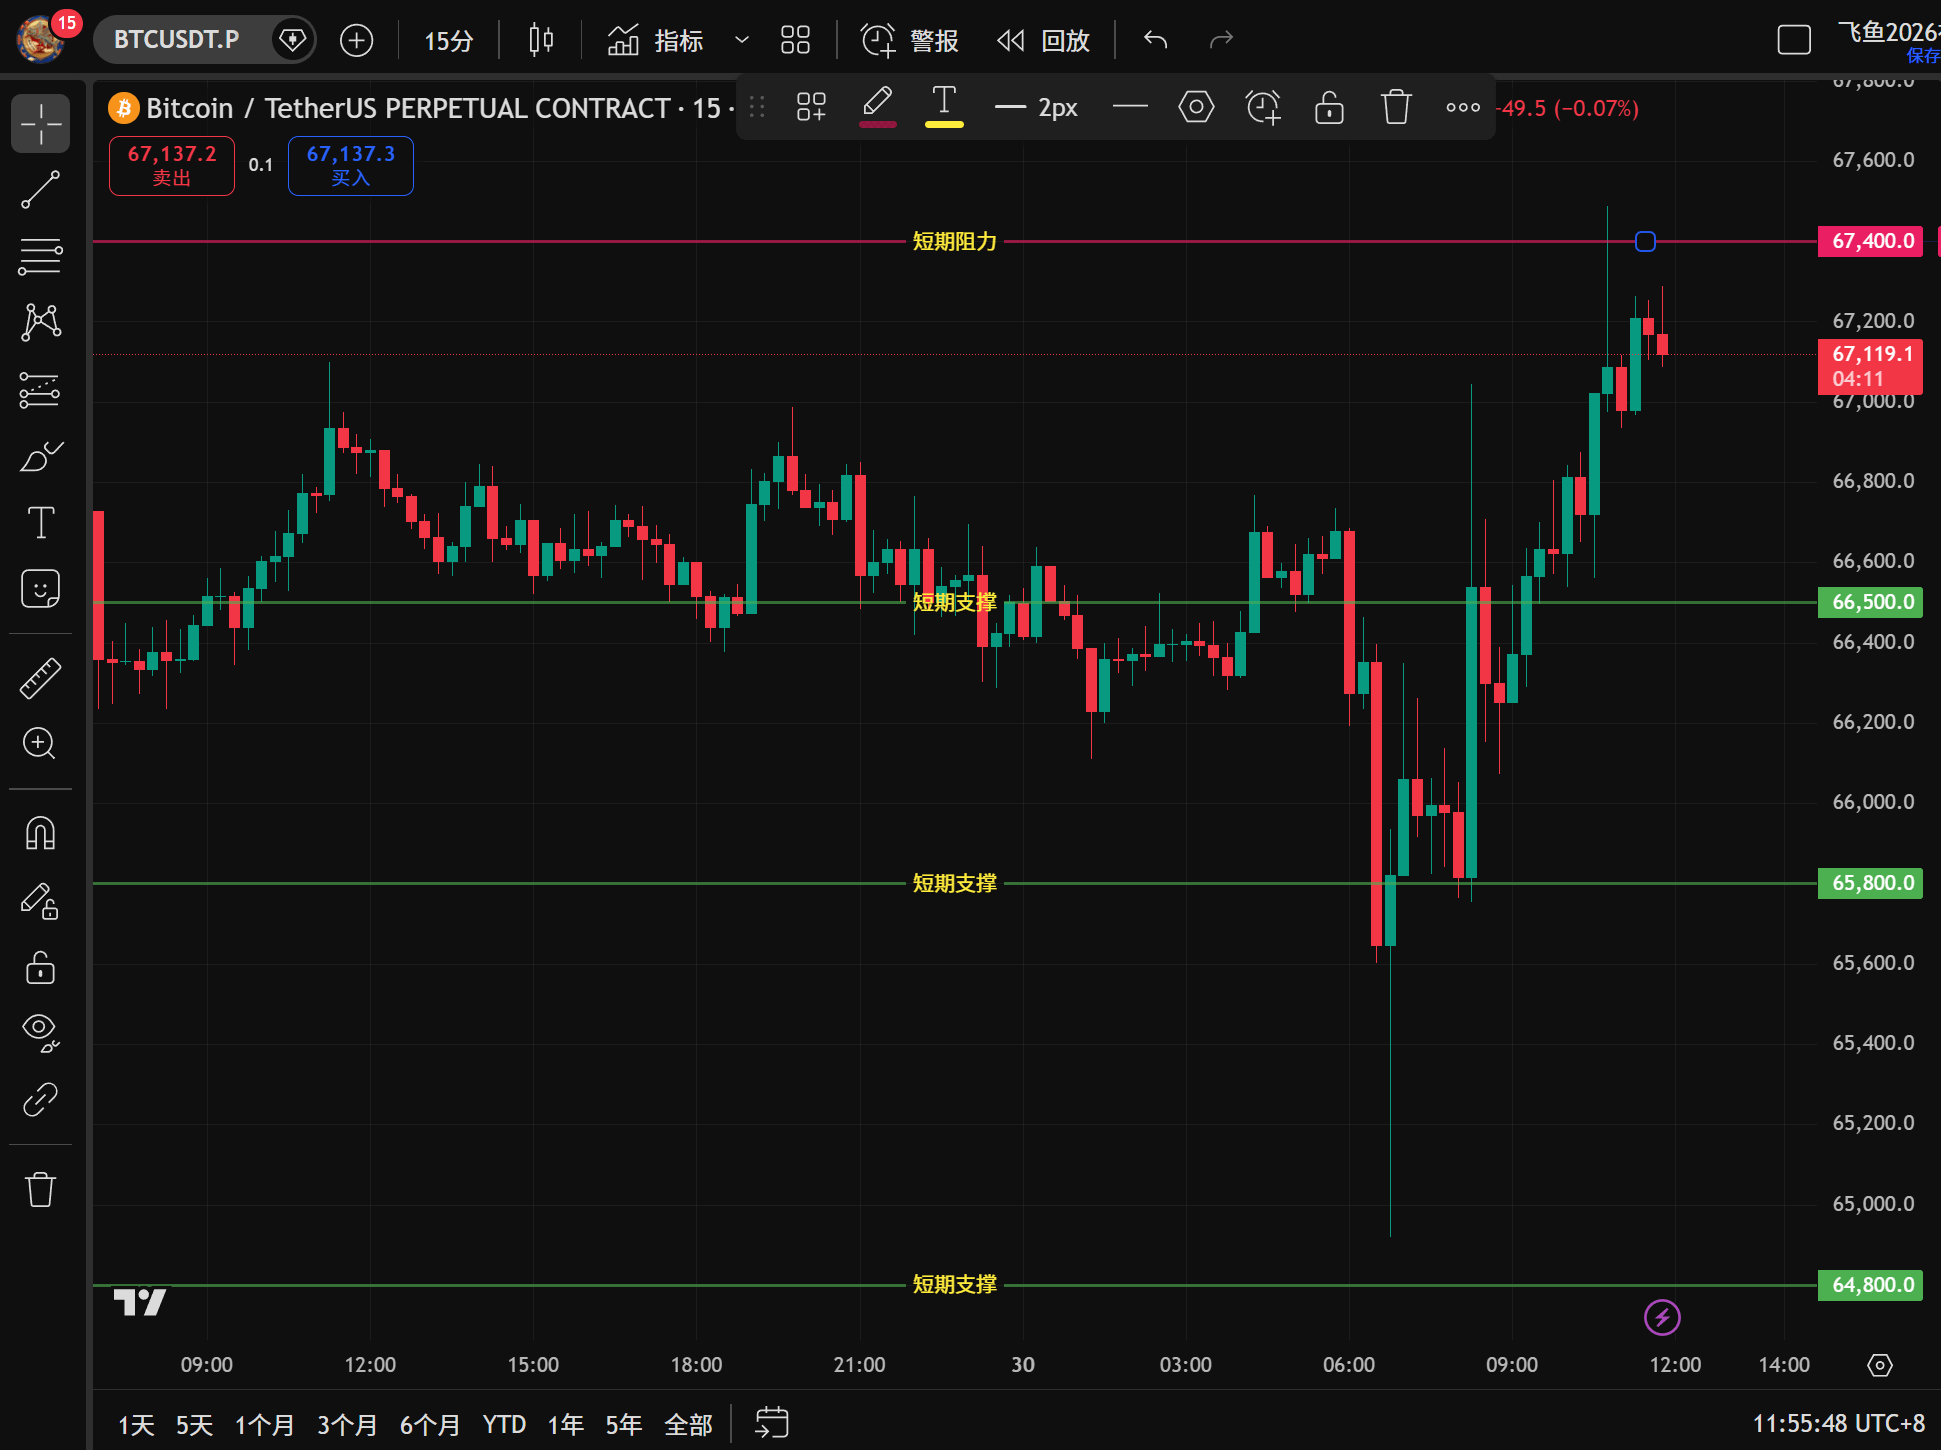
15-Minute Epic Heavenly Needle: Looking at this 15-minute chart, the morning session was simply a slaughterhouse! The price first declined slowly, then suddenly accelerated downwards without any bottom line, directly breaking through 65,000 to explore the extremely exaggerated area around 64,800. But immediately afterwards, a massive bullish candlestick rose up from the ground, instantly recovering lost ground and forming a textbook-level 'V-shaped reversal'. This is a very typical method of 'sweeping losses to take liquidity', where the main force ruthlessly wipes out all those who shorted and those who went long with low leverage, taking plenty of bloody chips.
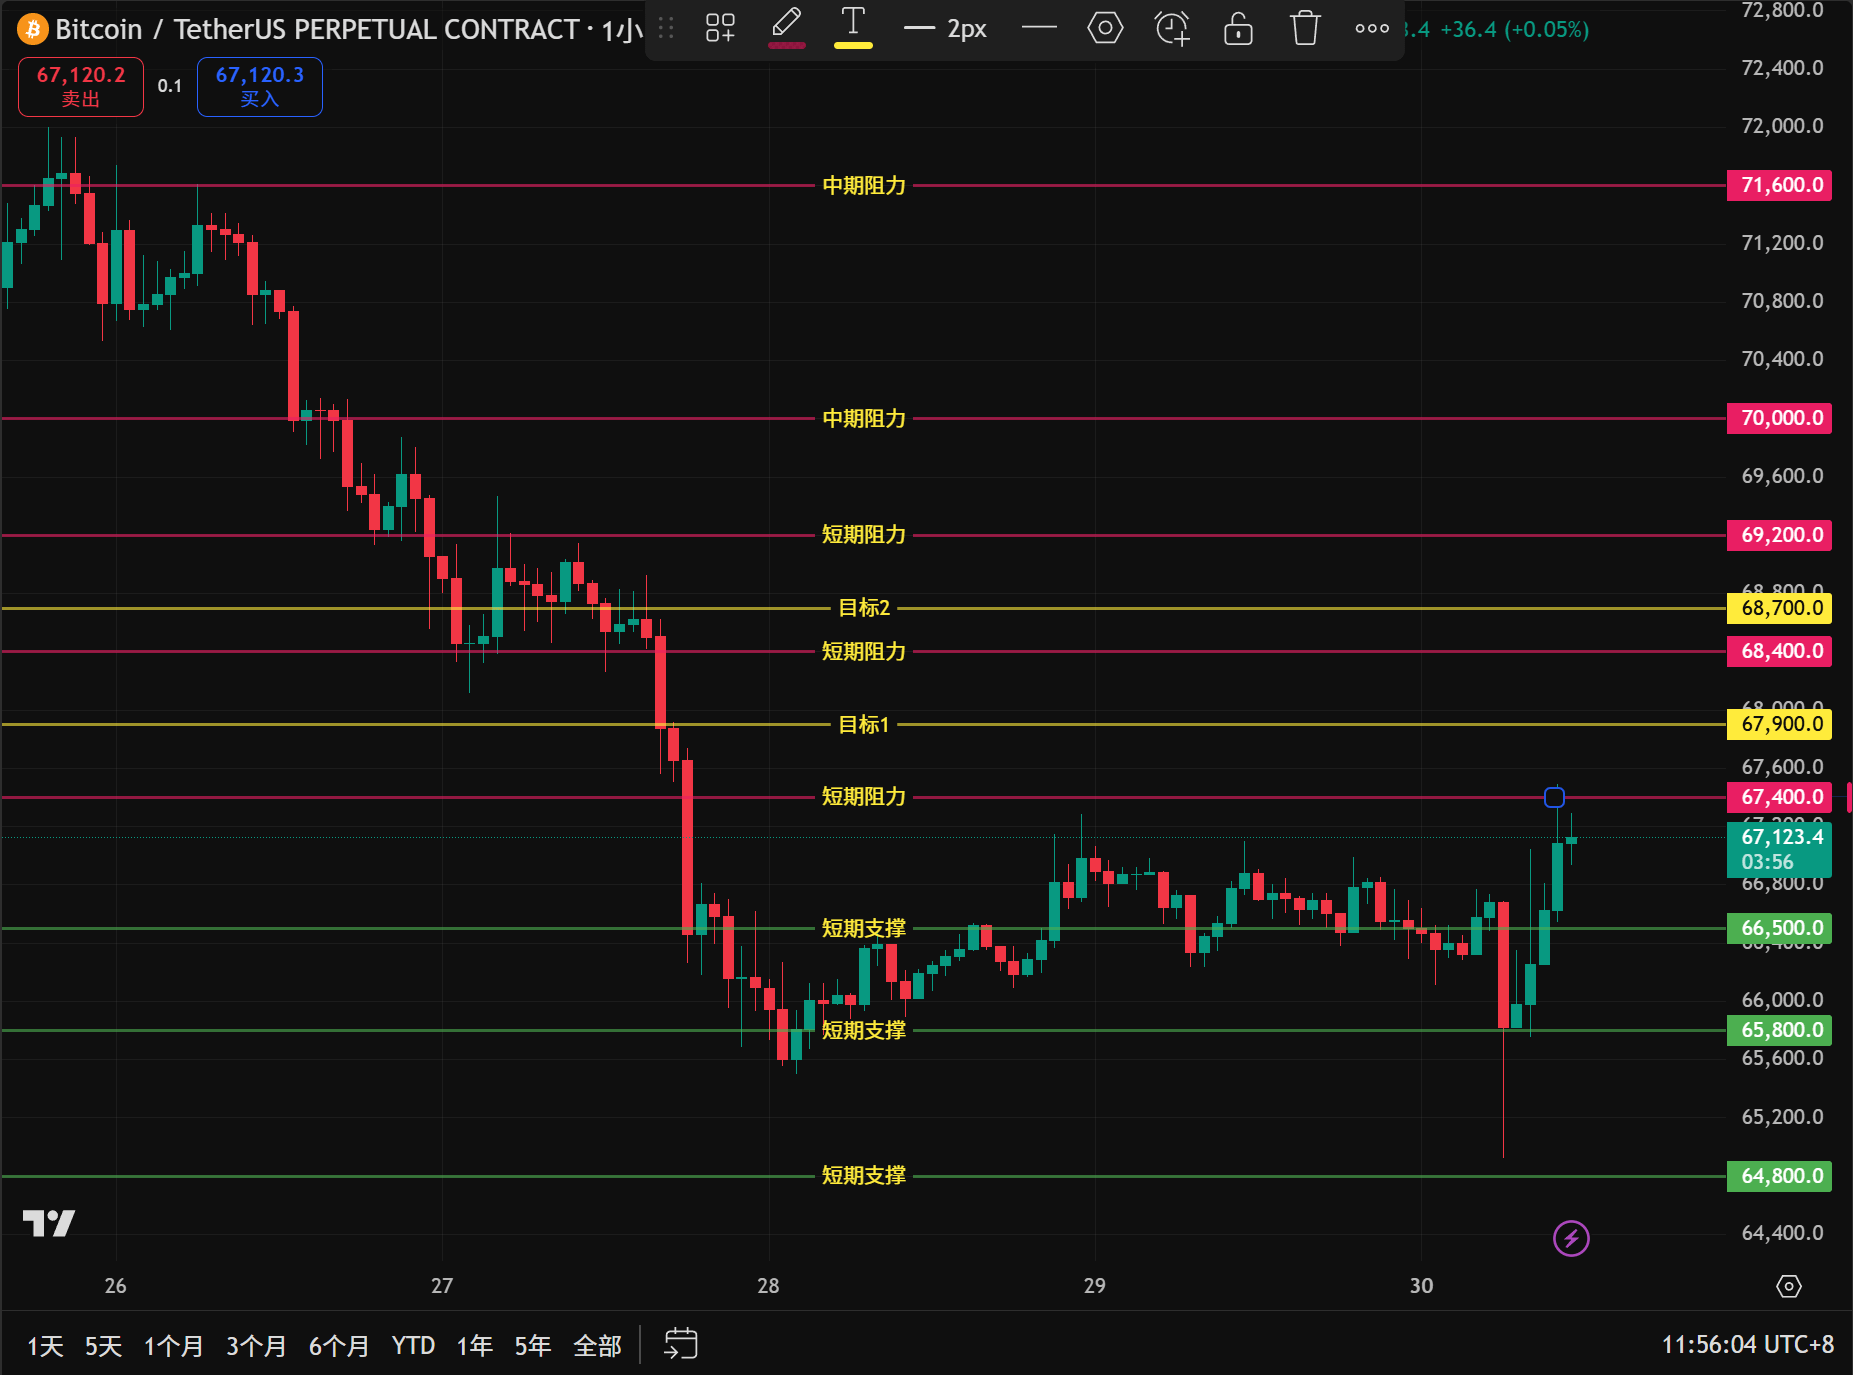
1-hour structure weak repair: Expanded to the 1-hour level, the large coin has been falling from 71,000 a few days ago and is still overall in a downward channel. Although the 'Dinghai Shenzhen' momentum in the morning is strong, this rebound is just stuck in the previous fluctuation resistance area around 67,400. Without continuous buying follow-up, this V-shaped rebound driven by liquidation can easily turn into a 'dead cat bounce.'
1. Support and resistance levels (Flying Fish morning calculation version)
🟢 Short-term support (1-3 days, intraday pullback defense area)
66,500: Immediate support. The central point of pause during this V-shaped reversal in the morning. If there is a pullback during the day, this is the first line of defense for bulls.
65,800: Strong support. The local bottom platform formed before the major drop on the 1-hour chart, also a dense area of contention between bulls and bears.
64,800: Core support (with blood pin). The absolute low point smashed out in the morning. This is the main force's trump card; if it breaks again in the short term, it will trigger deeper panic.
🔵 Medium-term support (1-2 weeks, swing accumulation area)
64,000: Major integer psychological level, also an important support zone at the previous weekly level.
62,500: Macro rising channel's lower boundary defense position.
60,000: The century iron bottom of the second half of the bull market, a consensus area across the network.
🔴 Short-term resistance (1-3 days, rebound high-pressure area)
67,400: Immediate resistance. The highest point area of the current rebound, also the first dense transaction area above the 1-hour chart.
68,400: Strong resistance (top-bottom conversion). The breakdown point from the sharp drop two days ago has now changed from support to a very strong resistance line.
69,200: Core resistance. The rebound high point before the last major drop on the 1-hour level, guarded by the air force.
🟠 Medium-term resistance (aiming at previous highs)
70,000: Major integer psychological barrier.
71,600: Recent 1-hour level high.
73,800: Macro historical peak.
2. Comprehensive analysis and best entry strategy
Comprehensive view:
Currently at 67,230, in the 'extreme pin wash after an extreme drop rebound repair period, with significant long-short divergence.'
Bullish strategy (trend pullback long): Since the main force has taken liquidity at 64.8k, there is a strong demand for a repair rebound in the short term. The core logic is 'do not chase high; wait for price to pull back to confirm stabilization at 66,500 support area before entering long.'
Bearish strategy (resistance level peak): The large-scale downward trend has not completely reversed. The core logic is 'relying on the short-term high-pressure area near 67,500 to make a rebound after an extreme drop.'