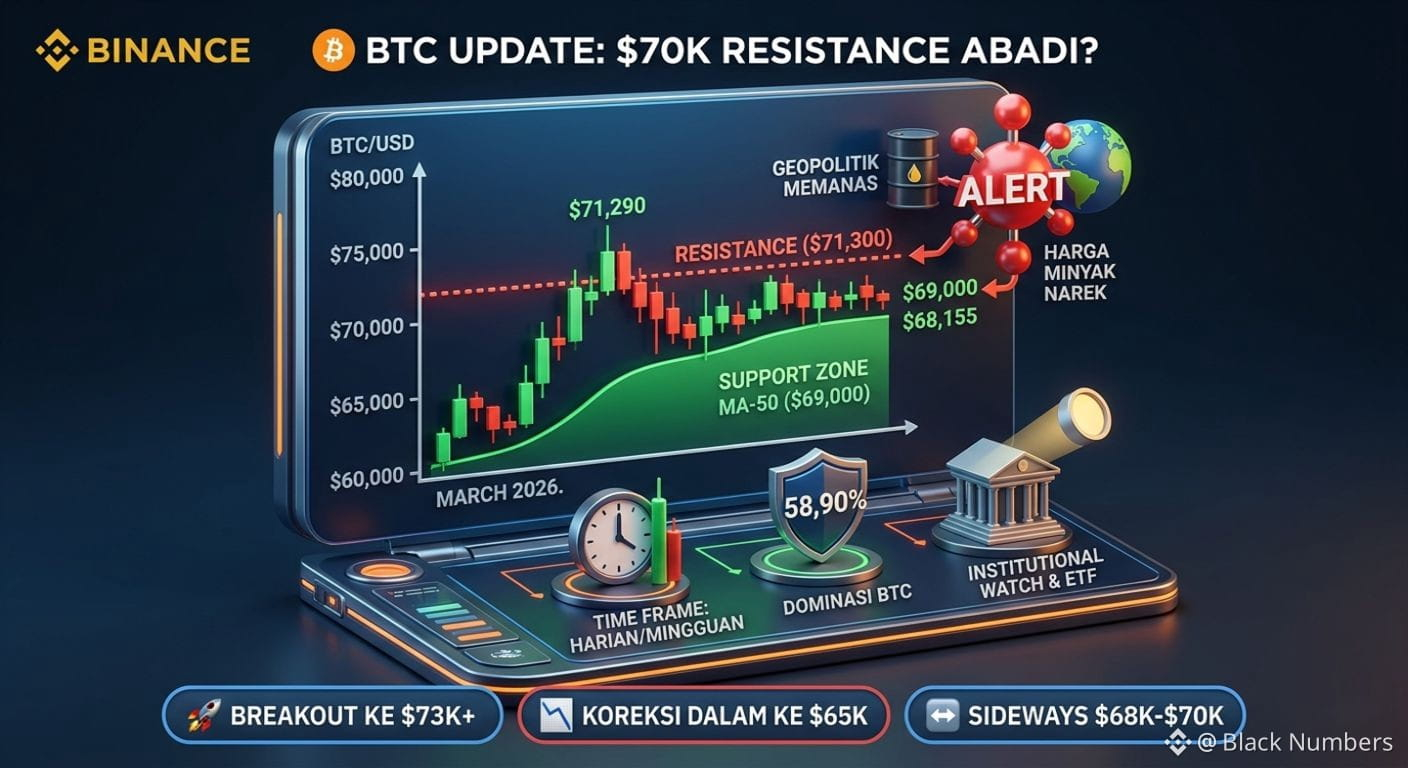
Bitcoin $BTC kembali menunjukkan volatilitas tinggi di penutupan Maret ini. Setelah sempat menyentuh level tertinggi di $71.290, BTC mengalami koreksi tajam menuju kisaran $68.000 - $69.000. Mari kita bedah apa yang sedang terjadi di balik layar.
1. Analisis Teknis: Berada di Persimpangan
Secara teknis, BTC saat ini sedang menguji MA-50 ($69.000) sebagai support krusial.
Support Terdekat: $68.155. Jika level ini jebol, kita mungkin akan melihat pengujian ulang ke area likuiditas di $66.500.
Resistance Utama: $71.300. Penutupan candle harian di atas level ini diperlukan untuk mengonfirmasi kelanjutan fase bullish menuju target psikologis baru.
Indikator: RSI mulai menunjukkan jenuh beli (overbought) di timeframe besar, menyarankan adanya konsolidasi sehat sebelum next leg up.
2. Sentimen Fundamental & Makro
Tensi Geopolitik: Ketegangan di Timur Tengah (AS-Iran) memicu lonjakan harga minyak mentah (Brent tembus $108). Hal ini meningkatkan kekhawatiran inflasi global yang bisa memaksa bank sentral mempertahankan suku bunga tinggi—sebuah sentimen negatif bagi aset berisiko.
Dominasi BTC: Berada di level 58,90%, menunjukkan bahwa meskipun pasar bergejolak, aliran modal tetap terkonsentrasi di Bitcoin dibandingkan Altcoin yang cenderung lebih tertekan.
Institutional Watch: Semua mata tertuju pada keputusan SEC terkait aplikasi ETF kripto baru yang dijadwalkan rilis minggu ini.
3. Strategi Trading (Smart Money Concept)
Amati area Fair Value Gap (FVG) di bawah $68k. Institusi seringkali mencari likuiditas di area ini sebelum melakukan akumulasi ulang. Jangan terburu-buru melakukan FOMO buy di tengah ketidakpastian berita makro.

----- > GLOBAL VERSION <-----
Bitcoin $BTC is exhibiting extreme volatility as we close out March 2026. After a strong push to a recent high of $71,290, BTC faced heavy selling pressure, pulling back sharply into the $68,000 - $69,000 range.
Here is the essential global macro and technical breakdown.
1. Technical Analysis: Key Support Under Fire
Technically, BTC is now testing the crucial 50-day Moving Average (MA-50), currently sitting around $69,000.
Key Support Level: $68,155. A decisive break below this could trigger a cascade toward the next major liquidity zone near $66,500.
Key Resistance Barrier: $71,300. This level is acting as stiff resistance. We need a sustained daily close above this mark to invalidate the current correction and resume the bullish trend toward new highs.
Momentum: The RSI on higher timeframes shows signs of cooling off from overbought conditions, suggesting this consolidation is necessary.
2. Global Macro Drivers: The "Risk-Off" Shift?
Escalating Geopolitical Tensions: The situation in the Middle East is rapidly deteriorating, driving Brent crude oil prices above $108/barrel. Rising energy costs are reigniting global inflation fears, complicating central bank pivot strategies and creating a "risk-off" environment.
The Dollar Factor (DXY): Markets are pricing in a potential delay in rate cuts. A strengthening US Dollar is providing headwinds for both equities and crypto.
Institutional Signal (58.9% Dominance): Bitcoin dominance remains exceptionally high at 58.9%. This indicates capital is rotating into BTC as a relative safe haven from Altcoins, rather than exiting the ecosystem entirely.
3. Strategic Outlook: Watching the FVG
Traders should closely monitor the Fair Value Gap (FVG) left below $68k. Smart money often seeks to fill these gaps for optimal entry before a major move. Patience is advised; chasing breakouts in this news-driven environment carries high risk.
🗳️ COMMUNITY POLL:
Where is BTC heading in the next 48 hours?
🚀 Breakout to $73,000+
📉 Deep Correction to $65,000
↔️ Sideways Consolidation ($68k - $70k)
Vote and share your rationale in the comments! 👇
#Bitcoin2026 #MacroEconomics #GlobalMarkets #GeopoliticalImpact #CryptoTrading