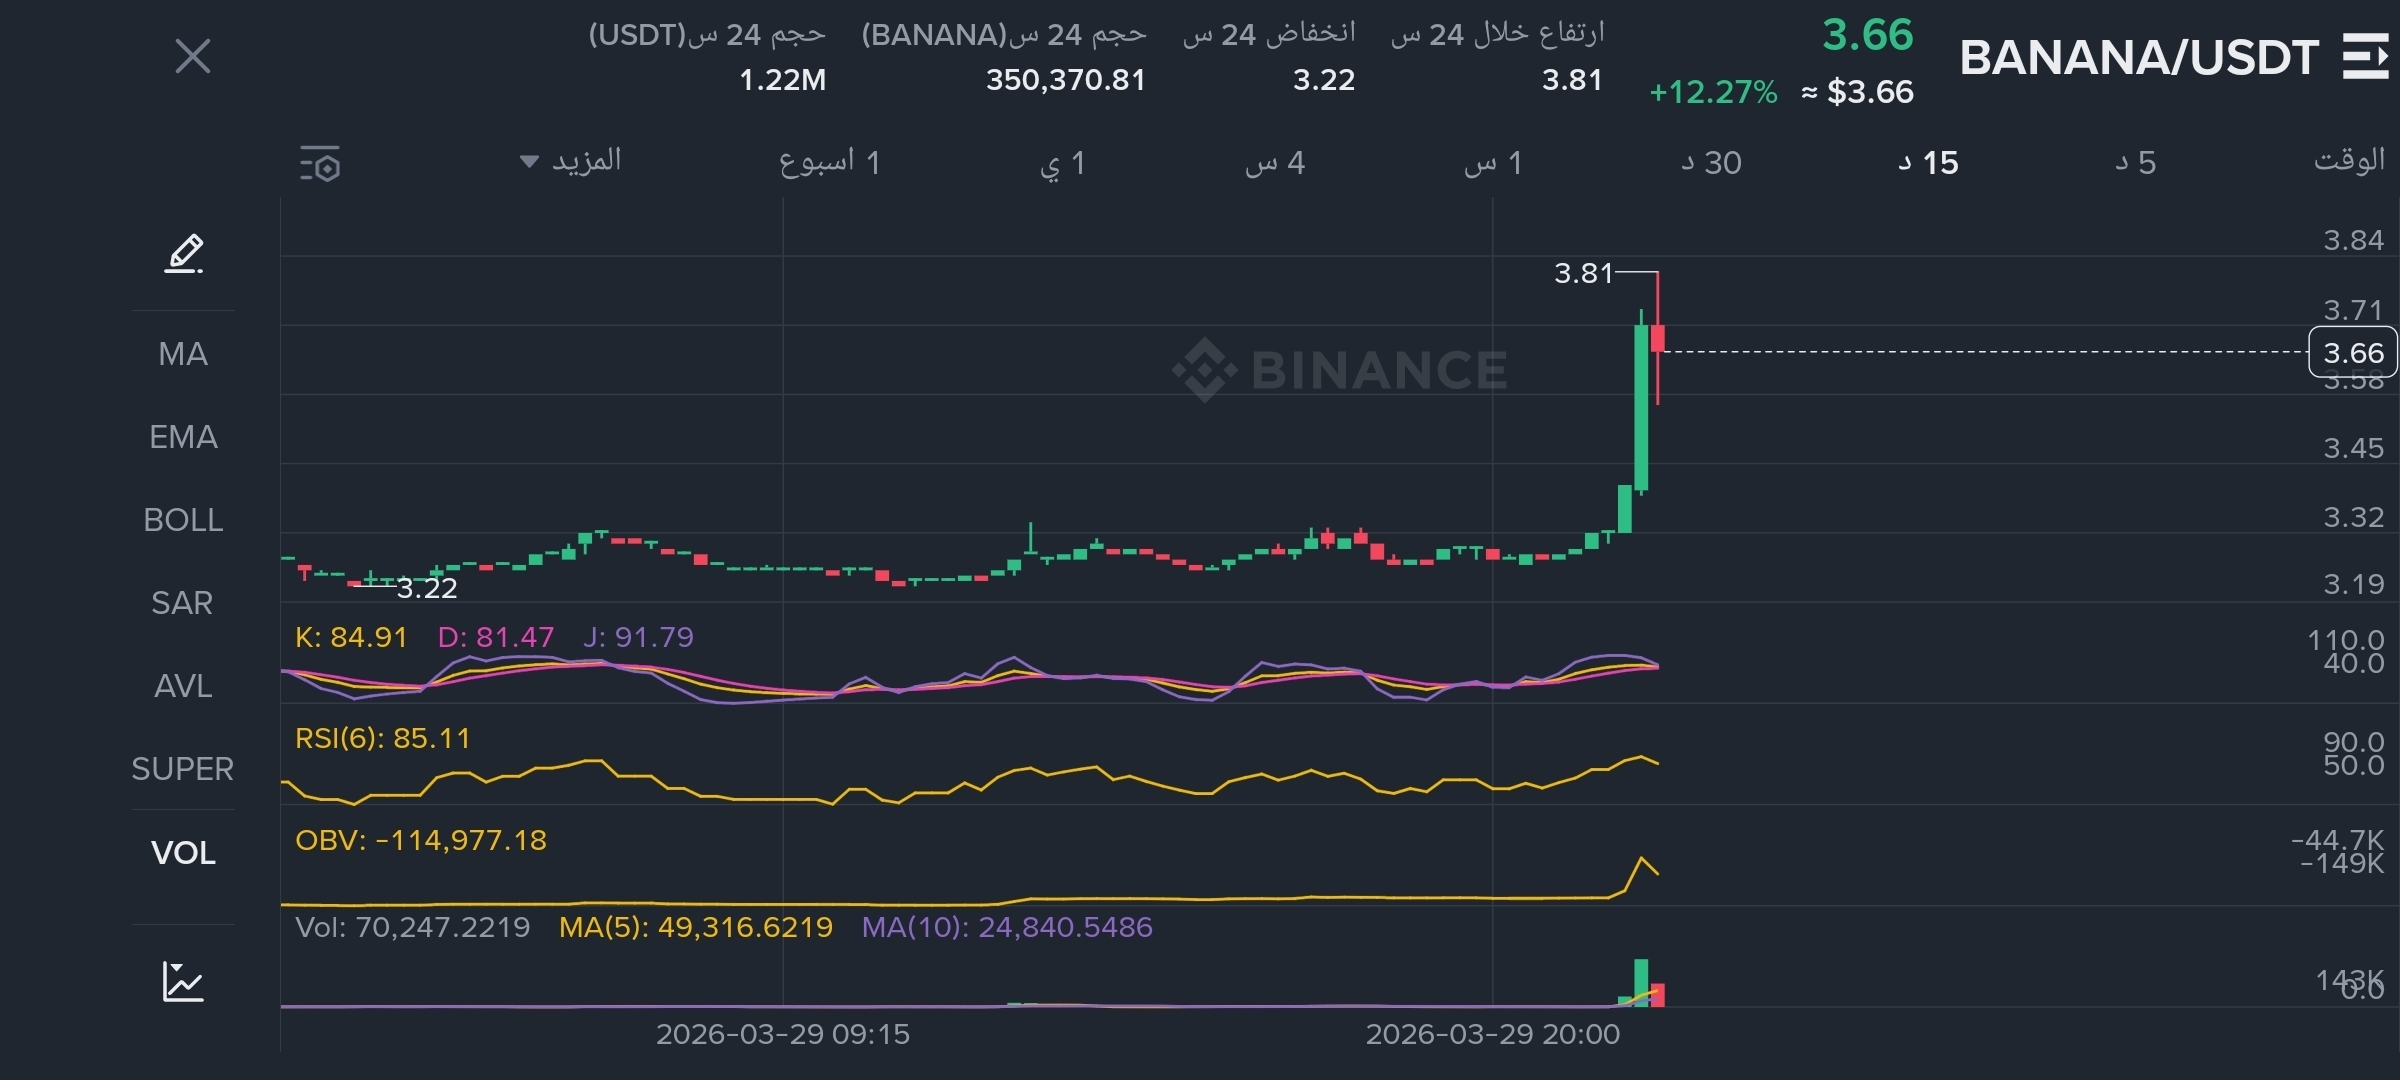
The BANANA currency has experienced a very strong upward movement in recent hours, breaking the sideways range it had been moving in for a long time. Here is the detailed current technical scene:
📊 Key technical notes:
Price breakout: The price successfully broke the horizontal resistance barrier at levels of $3.30, immediately launching towards a peak of $3.81. Currently, we observe a slight pullback to retest liquidity areas.
RSI Indicator (6): The indicator is currently at 85.11, which means the price is entering the "overbought" area. This usually indicates the likelihood of a slight correction or calm before continuing the rise.
OBV Indicator (On-Balance Volume): We observe a sharp rise in the OBV curve coinciding with the rise, which is a strong confirmation that the increase is supported by real liquidity (accumulation buying) and not just simple price manipulation.
Volume Bars: The trading volume in the last candle is very large compared to the previous period, which gives confidence in the current buying strength.
Targets and Levels:
Golden Support Area: Returning to test 3.55$ or even 3.40$ is considered an excellent accumulation opportunity for those who missed the initial entry.
Stubborn Resistance: Breaking and holding above 3.81$ will immediately open the door to the 4.00$ levels and beyond.
💡 Proposed Vision:
The currency is currently in a high "Momentum" state. Entering now may be risky due to the saturation of momentum indicators (RSI).
Entry Scenario: It is preferable to wait for the price to stabilize above the 3.55$ area or to return to test the 3.40$ levels to build new buying positions.
Alert: Breaking the 3.20$ level downwards cancels the current positive outlook and brings us back to the boring sideways path.