
Hello dear followers in #BinanceSquare let's take a quick look at the movement of the DIA/USDT pair after the recent fluctuations and the sudden liquidity that entered the game.
📍 Reading price action:
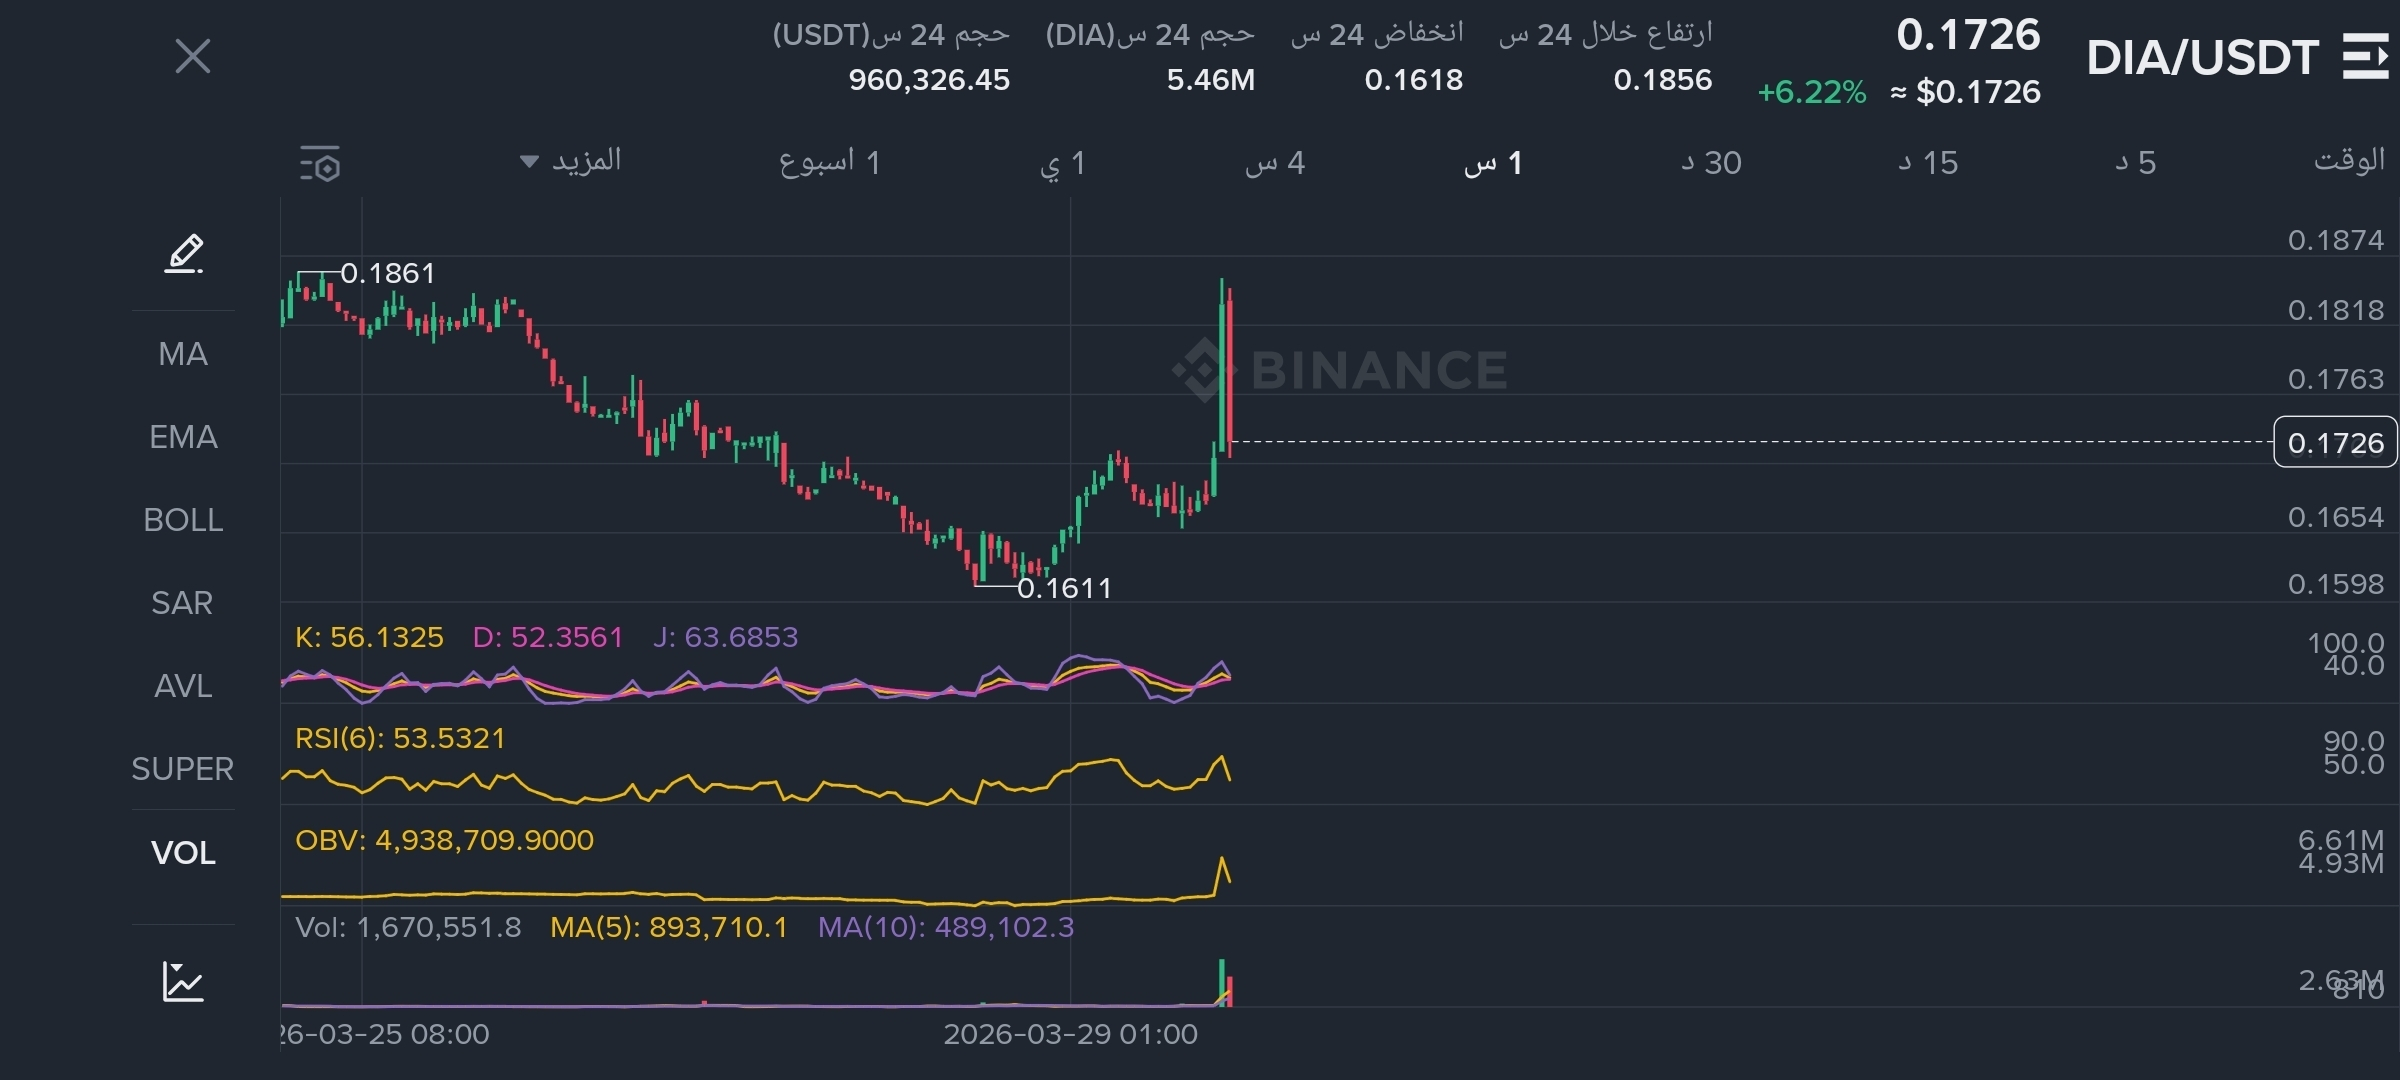
We witnessed a very strong breakout reaching levels of 0.1861 with a high momentum candle, but the rapid selling pressure caused the price to drop slightly to test the current support areas at 0.1726.
📊 Technical reading of the indicators:
Liquidity: There is a clear and real inflow of liquidity on the OBV, reflecting institutional interest or smart accumulation in these areas.
RSI Indicator: Currently positioned at 53, which means the currency is not in an overbought condition, and there is good room for a second upward wave if the price stabilizes.
🔍 Expected scenarios:
1️⃣ Positive scenario: Staying above the 0.1700 area (which has turned from resistance to support) opens the door again to target levels of 0.1850 then 0.1900 and above.
2️⃣ Corrective scenario: If the 0.1700 level is broken and closed below, we may see a return to test demand areas between 0.1650 and 0.1610.
💡 Advice for traders:
Watch the price behavior closely at the 0.1700 level; it is crucial in determining the next direction over the next few hours. Always make risk management and activating a "stop loss" part of your strategy.