The chart for PEPE shows a sideways movement leaning towards a decline in the near term, as the price approaches significant historical support levels with clear signs of "overselling."
What do the indicators say technically:
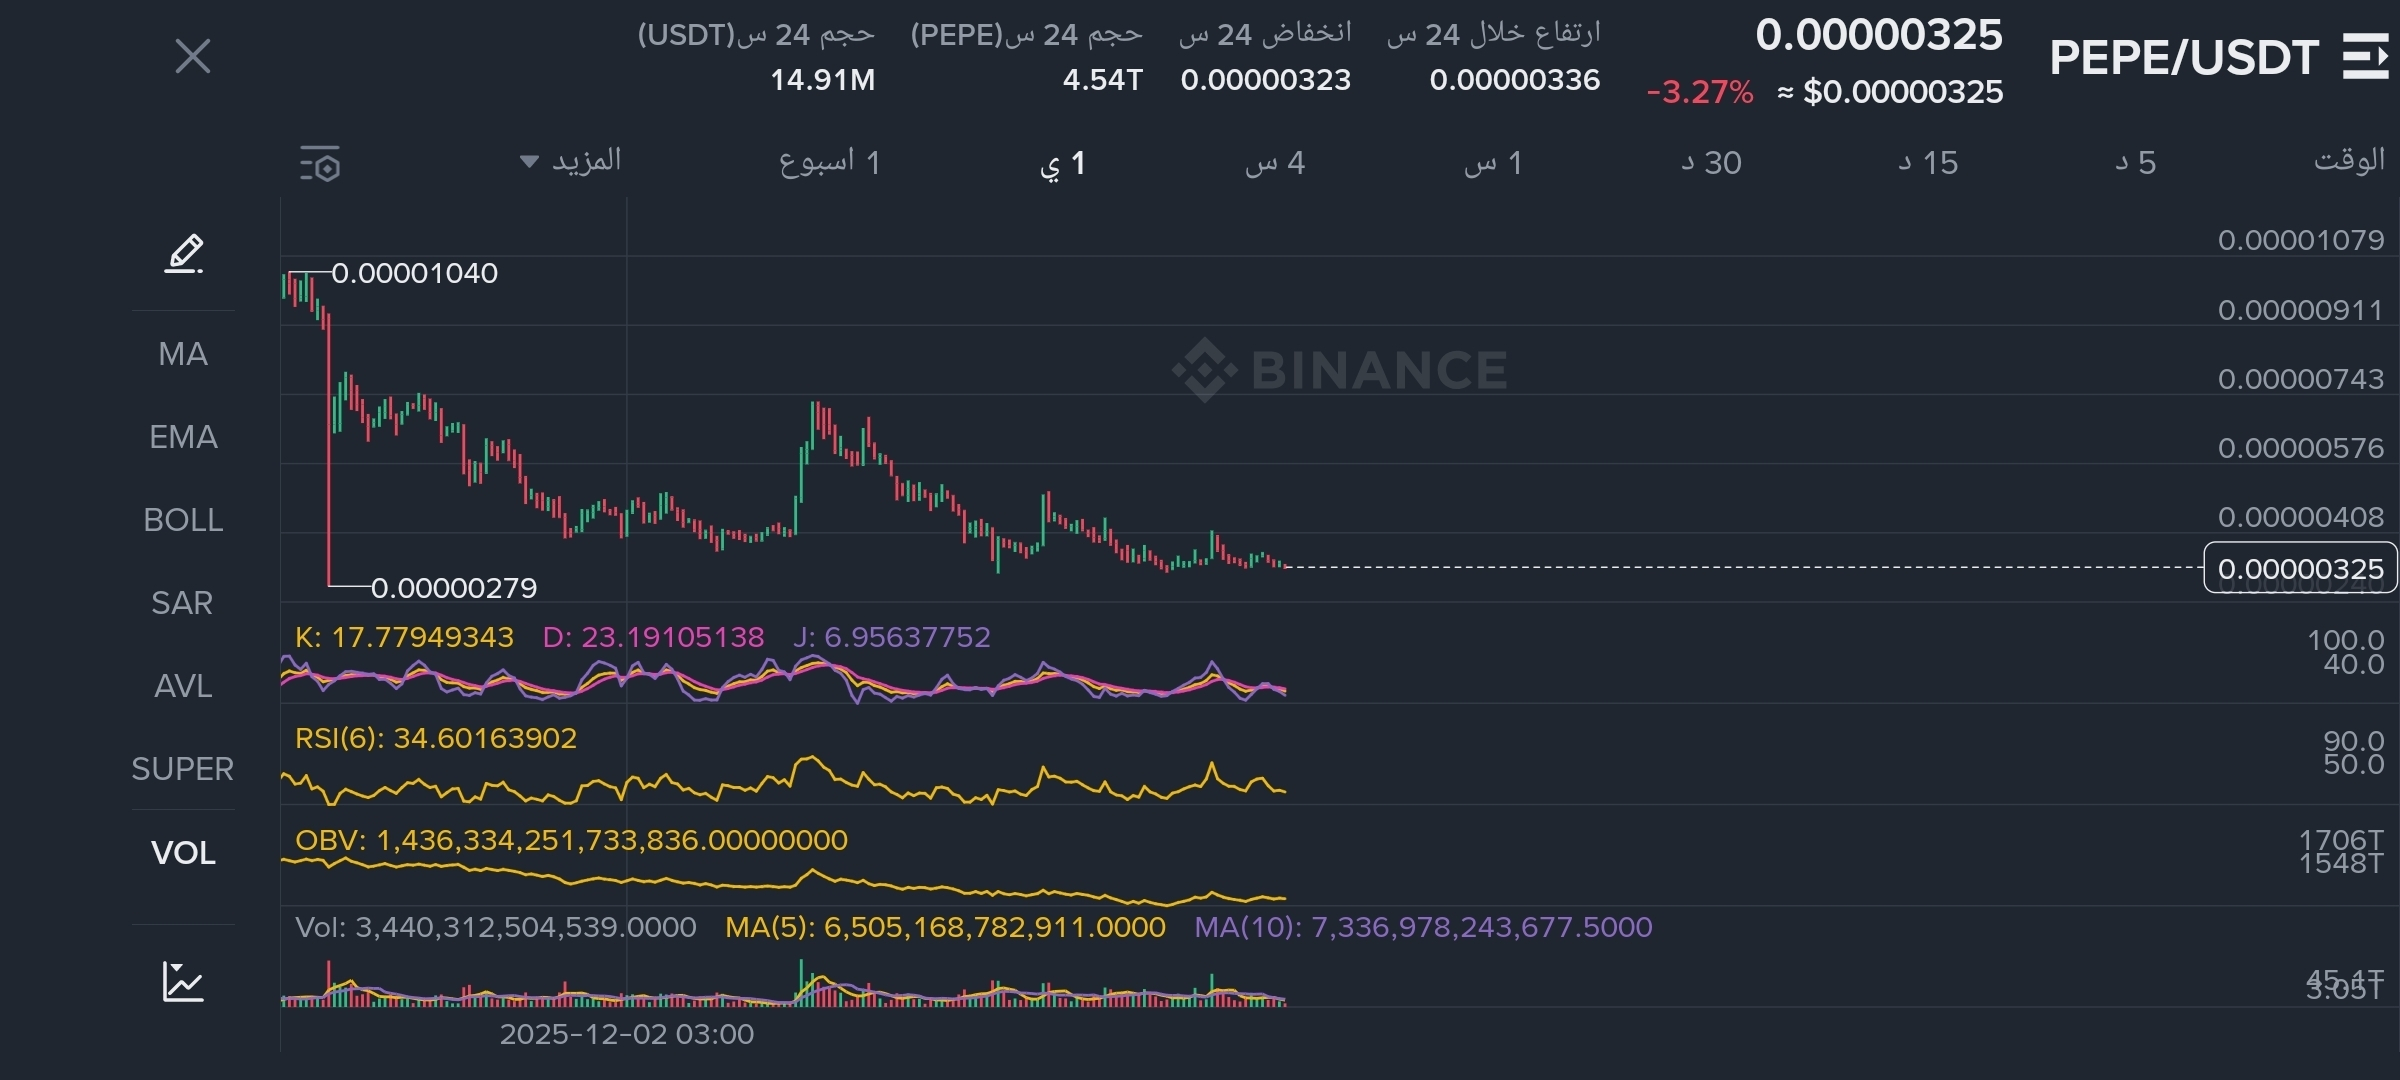
Price movement: The price is currently trading at 0.00000325, recording a slight decrease of 3.27% over the last 24 hours. The price is still above the previously recorded low of 0.00000279, indicating an attempt to build a price base.
KDJ Indicator: The indicator shows a very strong "oversold" condition, with the J line reaching 6.95. Historically, reaching these low levels for this indicator is followed by a price rebound upwards.
RSI(6) Indicator: It is at 34.60, which is close to the 30 area (Oversold), reinforcing the hypothesis of current selling pressure weakness.
OBV Indicator: We notice significant stability in cumulative trading volume (OBV), which indicates that recent downward price movements were not driven by major sell-offs.
Support and resistance levels:
Main support: 0.00000279 (breaking it opens the door for further decline).
Nearby resistance: 0.00000408 (previous moving averages area).
Major resistance: 0.00001040 (the historical peak illustrated in the chart).
Summary:
The technical indicators for $PEPE indicate that the price is in a very likely "bottom" area. Staying above the level of 0.00000279 is a prerequisite for any upcoming retracement towards the five-zero levels.
Do you think PEPE will start its rebound journey from here, or will it wait for another test of the level 0.00000279? Your opinion matters to us
Follow us for more
