$ETH Ethereum is struggling to maintain support at $2,000, with repeated failed bounces and clear resistance overhead keeping pressure on price.
Ethereum is sitting at a critical inflection point, hovering just above the $2,000 level after weeks of weak recovery attempts. As CyrilXBT noted, this level is holding - but only marginally - and the broader structure shows little evidence of strength returning. With price trading far below the 200-day moving average and every rally fading, the market is showing classic signs of distribution rather than accumulation.
✨A Market Stuck Below a Falling Ceiling
The chart reflects a clear downtrend that began with a sharp breakdown in early February. Since then, Ethereum has failed to reclaim higher levels, instead forming a series of lower highs and shallow rebounds.
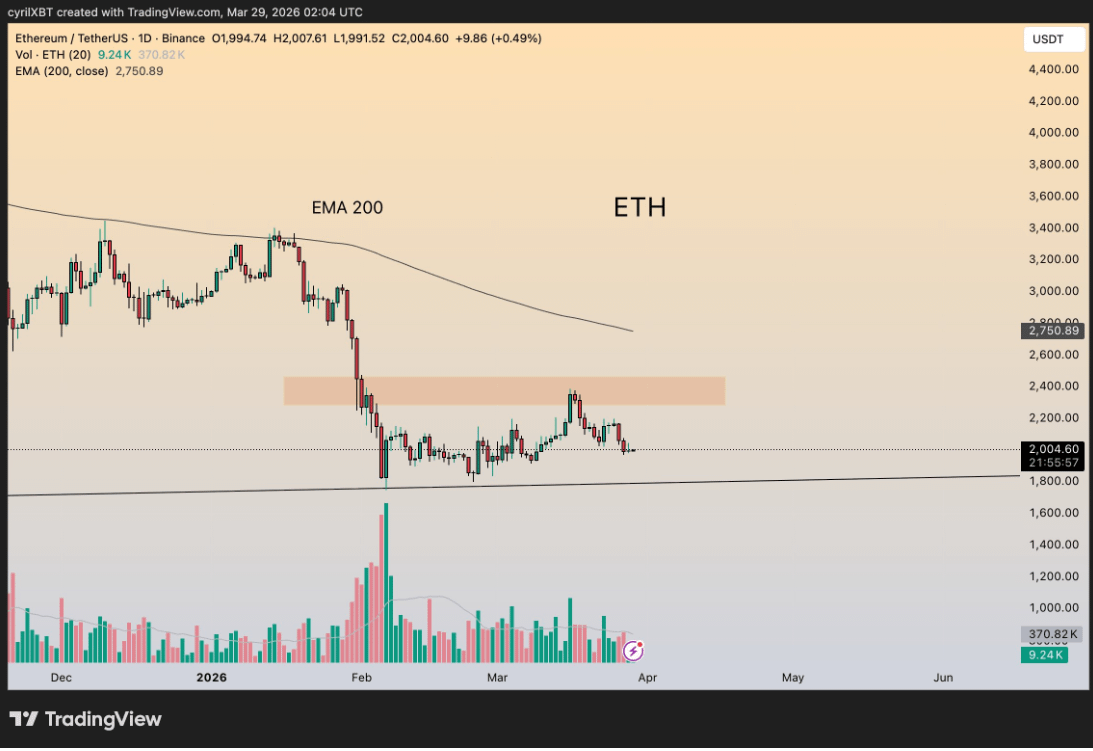
What defines this structure is consistency: each push upward loses momentum quickly, suggesting that sellers are stepping in aggressively on strength. The price remains compressed beneath a descending 200-day moving average near $2,750, reinforcing the broader bearish bias.
This distance from the 200-day moving average is not just technical noise - it highlights how far ETH has drifted from longer-term equilibrium, with no sign yet of a structural recovery.
ETH Tests $2,000 After Rejection at $2,150 captured an earlier stage of this same pattern, showing how the $2,150 zone began acting as resistance well before the current compression took hold.
✨The $2,200-$2,450 Supply Zone That Keeps Rejecting ETH
A key feature on the chart is the resistance zone between roughly $2,200 and $2,450. This area has repeatedly rejected price since the February breakdown, acting as a ceiling where selling pressure intensifies. Prior support flipping into resistance is a well-documented dynamic in ETH price behavior - and this zone is executing that role precisely.
Until Ethereum can break and hold above $2,200 with strong volume, the structure remains tilted to the downside. Every move into this range continues to behave like a failed breakout attempt rather than a trend reversal.
✨Pressure Building at the Critical $2,000 ETH Floor
The $2,000 level is now the most important battleground on the chart. While it has held so far, repeated tests are weakening its integrity. Price action shows tightening movement just above this level, with smaller bounces and quicker rejections - a sign that demand is fading.
ETH Price Analysis: Ethereum Accumulation Up 60% Despite $2K Drop adds an important counterpoint, showing that on-chain accumulation has been rising even as price weakens - a divergence that makes the current setup harder to read with confidence. ETH Slides as Ethereum ETF Outflows Hit 8-Day Streak reinforces the bearish side of that tension, with institutional flows continuing to move against the asset.
Each failed bounce reinforces the imbalance - without a reclaim of resistance, the structure continues to favor sellers.
If $2,000 breaks, the next logical area sits near $1,850, where a rising trendline provides potential support. Losing that level would mark a clear shift toward deeper downside. Ethereum is not collapsing - but it is not stabilizing either. The longer it trades below resistance and fails to reclaim higher levels, the more the current range starts to look like a pause before another leg lower.
♥️♥️♥️🚀🚀🚀FOLLOW ME 🌍🌎🌏
Appreciate my work. 😍 THANK YOU ! 😘
👉👉👉If You follow me, I'll follow you back as MutualFollow 💥✨🚀🚀🚀🚀🚀
MAKE YOUR ACCOUNT GROW !!! 🌍🌎🌏