As of late March 2026, TRIA—the native utility token for the self-custodial neobank Tria—is navigating a period of high volatility following its massive Q1 rally and major exchange listings (Binance, OKX, Coinbase).
While the project shows strong fundamental adoption (150,000+ users and $20M ARR), the technical setup suggests a "cooling off" period. Here is the technical breakdown for TRIA:
1. Key Price Levels & Structure
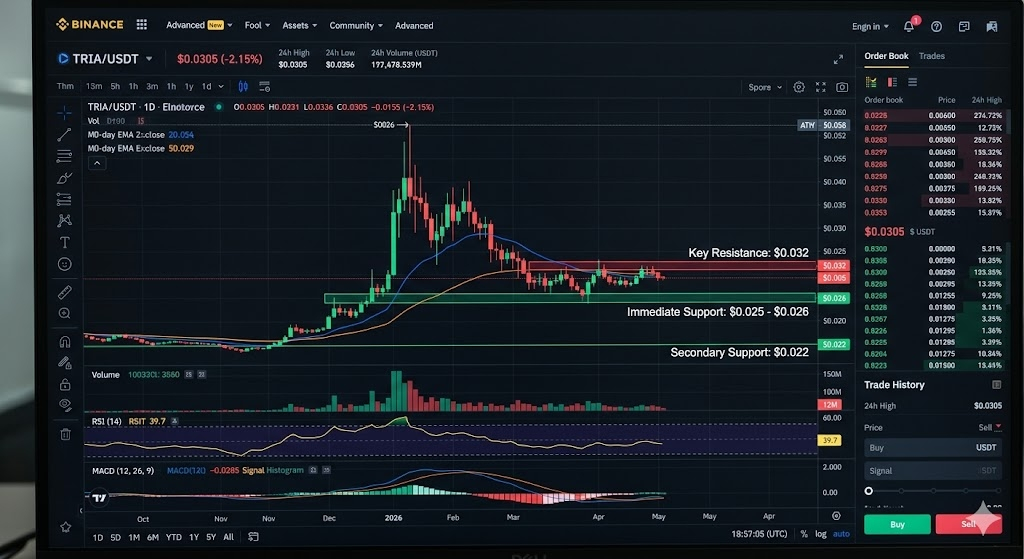
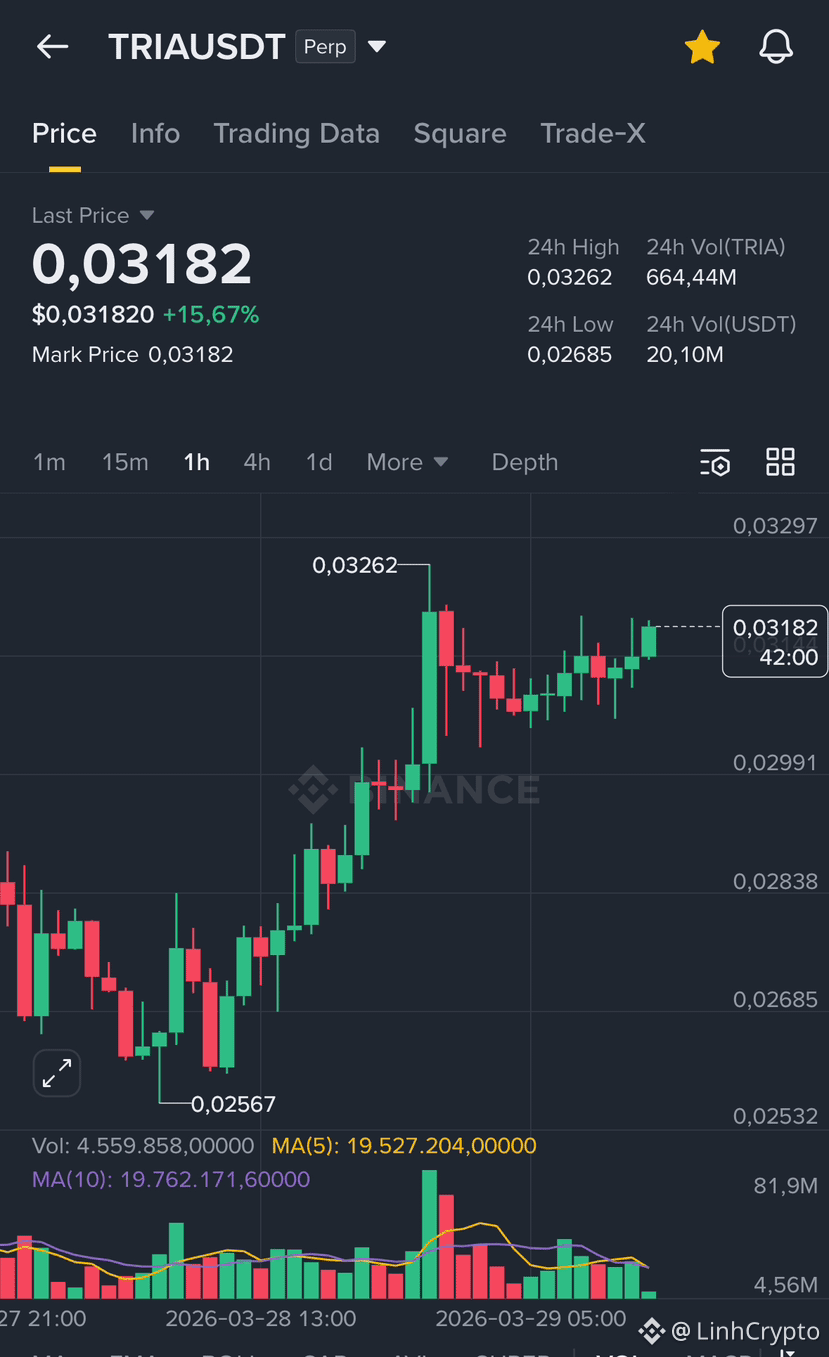
TRIA is currently trading in the $0.028 – $0.031 range, having recently retraced from an all-time high (ATH) near $0.050.
Immediate Support: $0.025 – $0.026. This is a critical "must-hold" zone. A daily close below this level could trigger a slide toward the secondary support at $0.022.
Primary Resistance: $0.032. The price has faced repeated rejection here. Reclaiming this level is necessary to flip the short-term bias back to bullish.
Major Resistance: $0.041 – $0.045. This zone sits just below the ATH and is likely to see significant "profit-taking" sell orders.
2. Momentum Indicators
The current technical bias is Neutral to Bearish on the daily timeframe as the market digests recent gains.
RSI (Relative Strength Index): Currently hovering around 39–42. This indicates that the token is approaching "oversold" territory but hasn't reached an extreme yet. There is room for a further dip before a natural bounce occurs.
Moving Averages: * TRIA is currently trading below its 20-day EMA ($0.032), which is acting as dynamic resistance.
It remains above the 50-day EMA ($0.024), suggesting the medium-term uptrend is technically still intact despite the recent correction.
MACD: The MACD line has crossed below the signal line with a growing negative histogram. This confirms that bearish momentum is currently dominant in the short term.
3. Volume & Liquidity Analysis
A concerning metric for TRIA is its recent liquidity thinness.
Volume Imbalance: Trading volume has recently seen sharp 90%+ drops on some days, leading to "slippage" and exaggerated price swings.
Futures vs. Spot: There is a notable imbalance where futures volume (on platforms like Binance/Bybit) often dwarfs spot volume by 6x. This "paper trading" dominance makes the asset susceptible to long/short squeezes, where a small move can trigger a cascade of liquidations.

 TRIAUSDTPerp0.0318+7.90%