

Bitcoin is sitting at a key support area where the next move could shape the short term trend. One chart points to a brief bounce before another drop, while another says support could trigger a relief rally if it holds.
Bitcoin Eyes Brief Bounce Before Another Drop, Trader Says
A daily chart of Bitcoin shared by veteran trader Matthew Dixon suggests a short-term push upward could come first, followed by another downside move. The setup implies Bitcoin may initially rally to trigger a short squeeze before potentially reversing if key resistance levels remain intact.
At the time of the chart, BTC was around $66,170, with upside targets mapped near Fibonacci zones between roughly $69,483 and $74,894. This area is viewed as a likely test region where momentum could fade again, indicating that the chart is not pointing to a strong, sustained breakout yet.
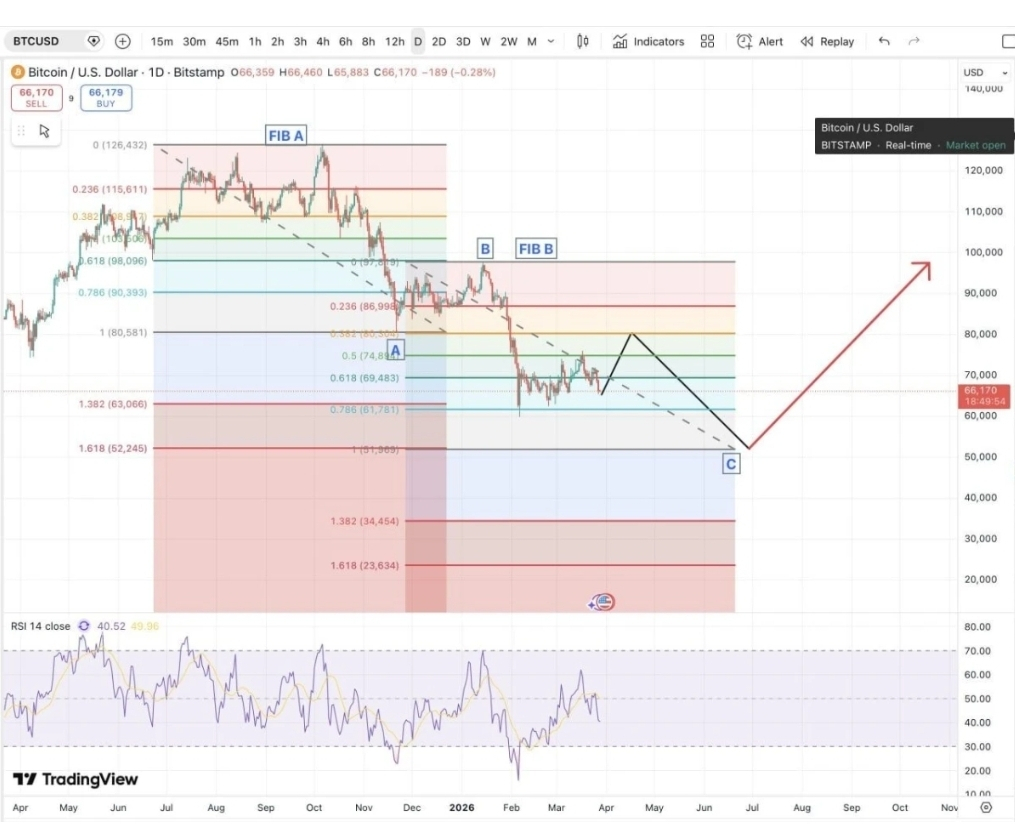
A dashed descending trendline still suggested a downward bias, keeping the broader structure under pressure. The black projected path indicated a short-term rally into resistance, followed by a drop toward the marked C zone around $51,969. After that, a red arrow showed a potential stronger rebound toward significantly higher levels later on.
Overall, the setup blends near-term bearish pressure with a longer-term recovery outlook. Bitcoin could first move up to squeeze short positions, but if sellers step back in at resistance, another decline may follow before a larger upside trend develops.
Matthew Dixon also warned that markets can remain irrational longer than traders can stay solvent, highlighting the risk of entering positions too early. For now, the chart suggests a possible bounce first, while still keeping a deeper downside move in play for Bitcoin.
Bitcoin Tests Key Support as Trader Sees Room for Short Term Rally
A two-day chart of Bitcoin shared by TedPillows shows price sitting at a key support zone after a sharp drop earlier this year. The analyst highlighted the $65,000–$66,000 range as the crucial level to monitor, as it currently serves as a short-term floor.
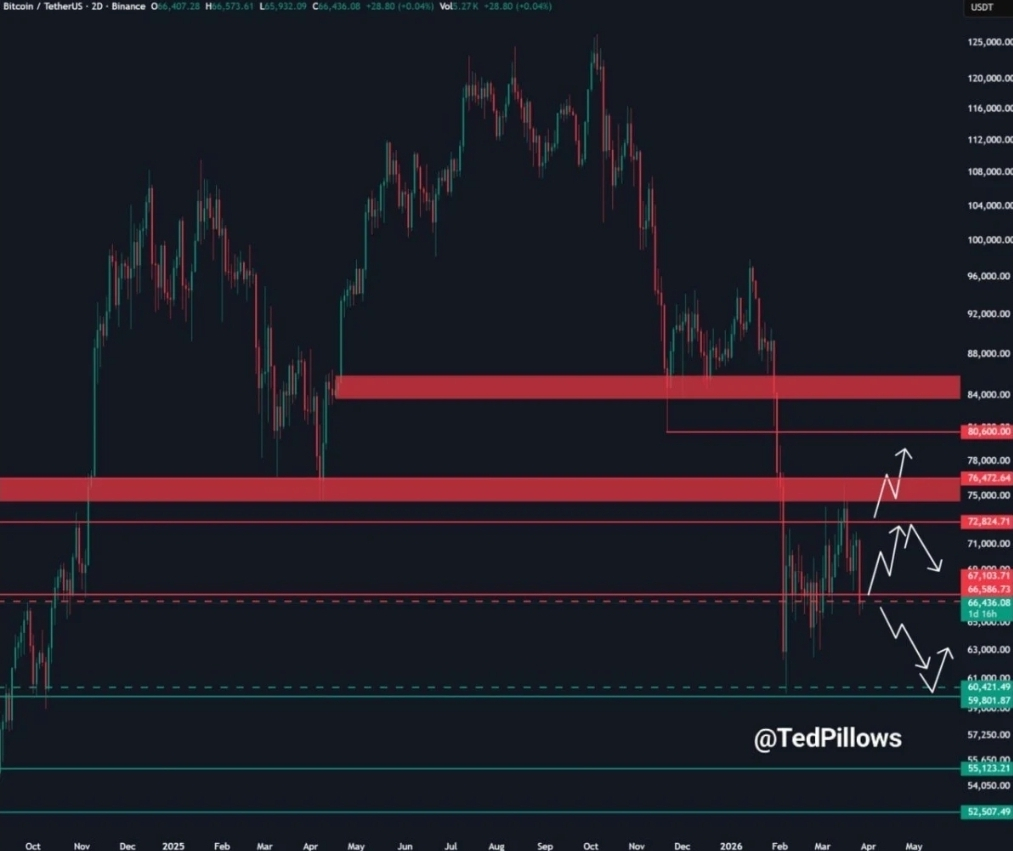
The chart outlined multiple potential scenarios from this point. If Bitcoin manages to hold the current support zone, it could see a rebound of roughly 6% to 8%, with upside targets sitting around the low $70,000 range and extending into the mid $70,000s. In that case, buyers would need to defend this area and drive price back into prior resistance levels.
On the other hand, the chart also highlighted bearish outcomes if support breaks. A drop below this range could expose lower levels near $60,000, followed by the mid $50,000s, making the structure highly dependent on whether this zone holds.
Overall, Bitcoin is at a key decision point. While support could trigger a relief bounce, a breakdown would likely extend the correction before a stronger base is established.