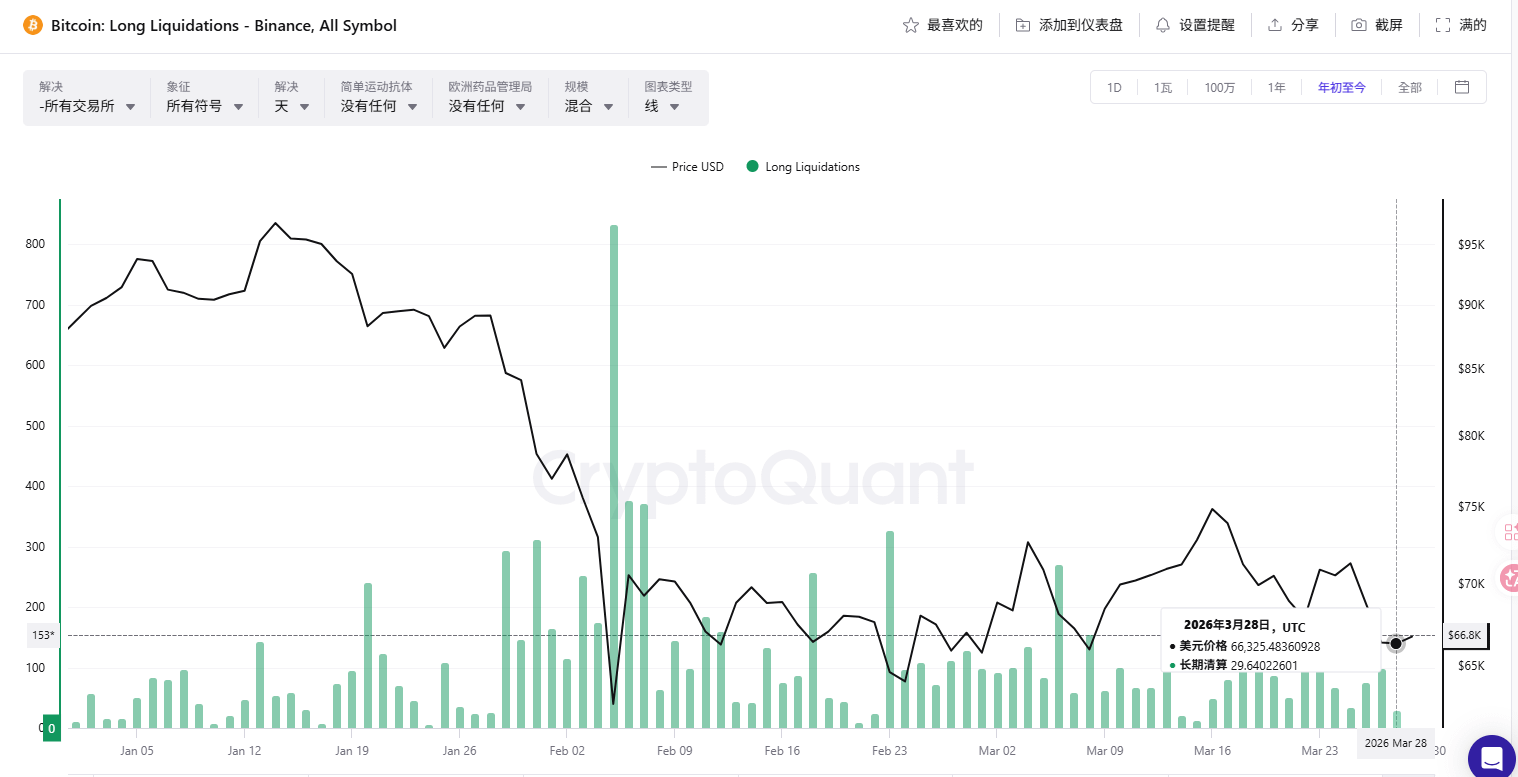
From the perspective of Binance long liquidation volume, there have been three waves of concentrated liquidations since the beginning of the year:
In mid-January, BTC fell from $95,000, and the liquidation volume gradually increased, with a daily peak close to 700; the 'tariff nuclear bomb' at the beginning of February caused BTC to plummet to around $75,000 overnight, with the daily long liquidation volume soaring to over 800, marking the most extreme liquidation this year; subsequently, from late February to early March, the price fluctuated repeatedly in the range of $70,000-$80,000, with each fake rebound accompanied by long liquidations in the hundreds.
However, after mid-March, the liquidation pillars have noticeably shrunk. In the past two weeks, the daily long liquidation has basically remained in the low range of 30-100.
This indicates two things: first, leveraged longs have been mostly cleaned out; second, the remaining long positions are light and have distant stop losses, making them hard to be wiped out. Simply put, the most fragile chips in the market have exited.
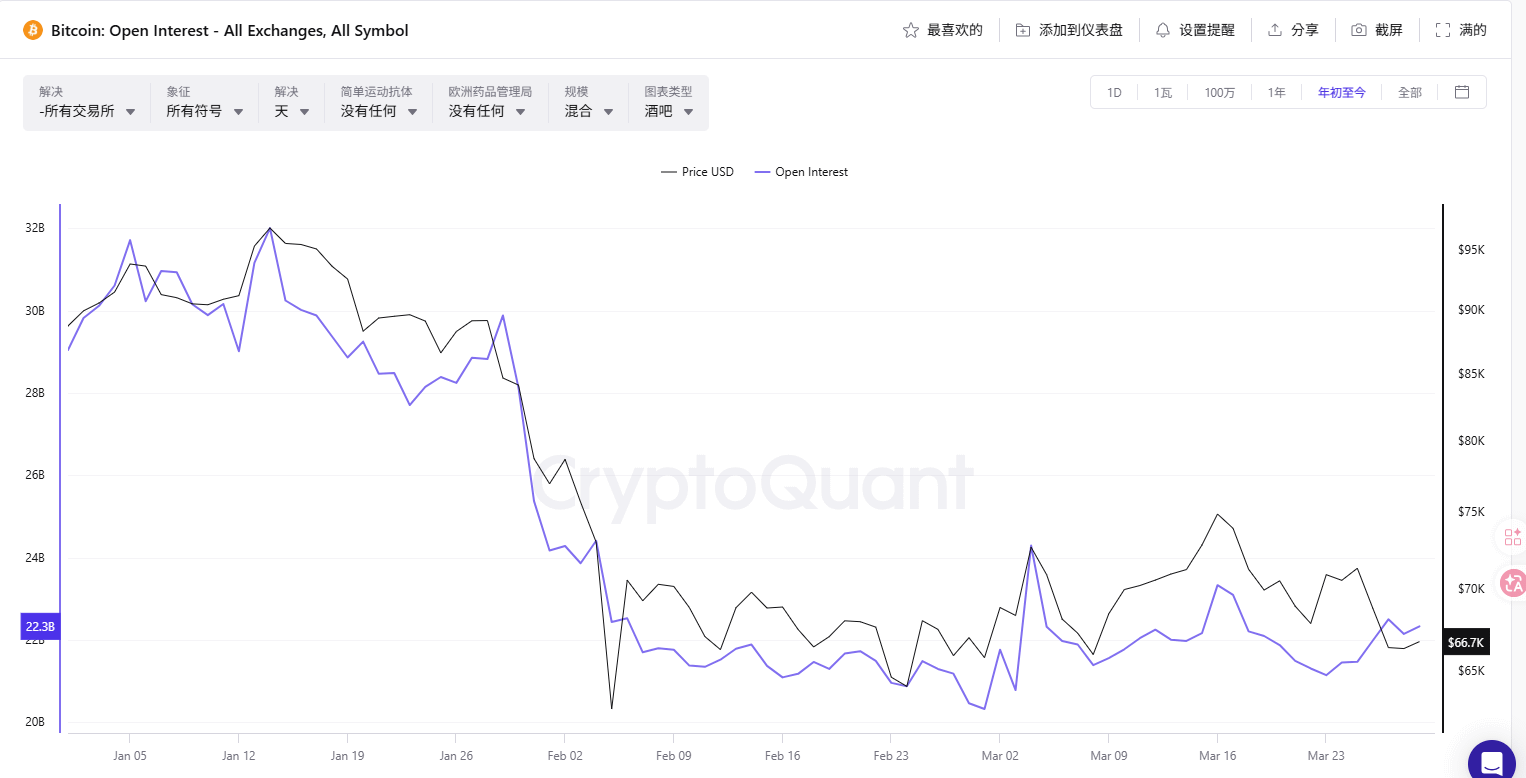
Let's take a look at the open interest (OI).
At the beginning of the year when BTC was at $95,000, the total market OI was about 32B. Subsequently, the price plummeted, and OI simultaneously collapsed from 32B to 22B—10B of contracts were liquidated or actively closed, evaporating a full third. This round of deleveraging bottomed out in early February.
After that, OI began to slowly recover: 22B → 23B → 25B. But in recent days, it has fallen back from 25B to 22.3B, while the price has dropped from $75,000 to $66,700.
Here is a key detail: OI has shrunk but has not collapsed.
If the panic selling triggered by leveraged liquidations occurs, OI will experience a cliff-like drop. But in reality, OI has only gently retreated, indicating that this round of decline is more dominated by selling pressure from the spot market rather than a chain liquidation in the derivatives market.
In summary, the current derivatives structure shows a characteristic: deleveraging is basically complete + prices are still weakening.
This combination historically corresponds to the latter half of a decline—because the positions that could explode have already exploded, and the remaining decline is more about emotional inertia than structural risk. Similar to the phases in July 2022 and September 2025.
What’s worth noting next is whether OI can stabilize and recover around 22B, and the direction of new contracts entering the market. If OI rises while funding rates remain low or even negative, then shorts are adding positions—the fuel for short squeezes is accumulating.
During sensitive time periods and at sensitive price levels, partners should avoid high leverage and cautiously pursue short positions; and always pay attention to changes in funding rates and OI.
