As of March 29, 2026, Ethereum (ETH) is trading around the critical $2,000 psychological level, finding itself at a decisive technical juncture. The current market structure represents a classic conflict: historically strong on-chain fundamentals are being overwhelmed by deteriorating technicals and a risk-off macro environment .
1. Candle Chart & Technical Structure
The daily and 4-hour candle charts reveal a market that has shifted from consolidation to a fragile bearish structure.
· Downtrend Confirmation: After failing to break resistance near $2,400 in mid-March, ETH has formed a series of lower highs. On the 4-hour chart, price action is trapped within a falling channel that began on March 16, with the upper boundary acting as dynamic resistance near $2,110 .
· Key Moving Averages: ETH is trading well below the 100-day ($2,500) and 200-day ($3,100) moving averages, both of which are sloping downward, indicating a long-term bearish bias .
· Critical Support ($1,970 - $1,927): The immediate support zone sits between $1,970 (0.618 Fib level) and $1,927 (lower Bollinger Band). A decisive 4-hour or daily close below this zone would likely accelerate selling toward the $1,800 region .
· Resistance Levels: For any bullish reversal to gain traction, ETH must reclaim the $2,050 zone, followed by the 20-day moving average at $2,117 .
2. Fundamental Tug-of-War: Supply Shock vs. Demand Destruction
The current price action is defined by a unique divergence between on-chain supply dynamics and external demand pressures.
Bullish Supply Dynamics:
· Record Staking: Over 33% of the circulating supply (~38.1 million ETH) is now locked in staking contracts, drastically reducing liquid supply on exchanges .
· Exchange Outflows: Exchange reserves have hit their lowest level since 2016, suggesting that the available "float" of ETH for selling is historically tight .
Bearish Demand & Macro Pressures:
· ETF Outflows: U.S. spot Ethereum ETFs have seen consistent outflows, with a seven-day streak totaling over $158 million in exits, signaling waning institutional interest .
· Weak Technical Demand: The Money Flow Index (MFI) shows a bearish divergence, meaning that while prices attempted to rally in March, buying volume was weakening .
· Macro Headwinds: Geopolitical tensions (Iran) and inflation fears have triggered a broad risk-off sentiment, driving capital out of crypto assets regardless of internal structural tightness .
3. Market Sentiment & Positioning
Market sentiment is characterized by extreme caution and structural fragility due to high leverage.
· Leverage Risk: The Estimated Leverage Ratio for ETH has hit all-time highs. This creates a fragile market where any downward move can trigger a cascade of long liquidations, amplifying volatility . Recent data showed over $110 million in long liquidations during the drop below $2,000 .
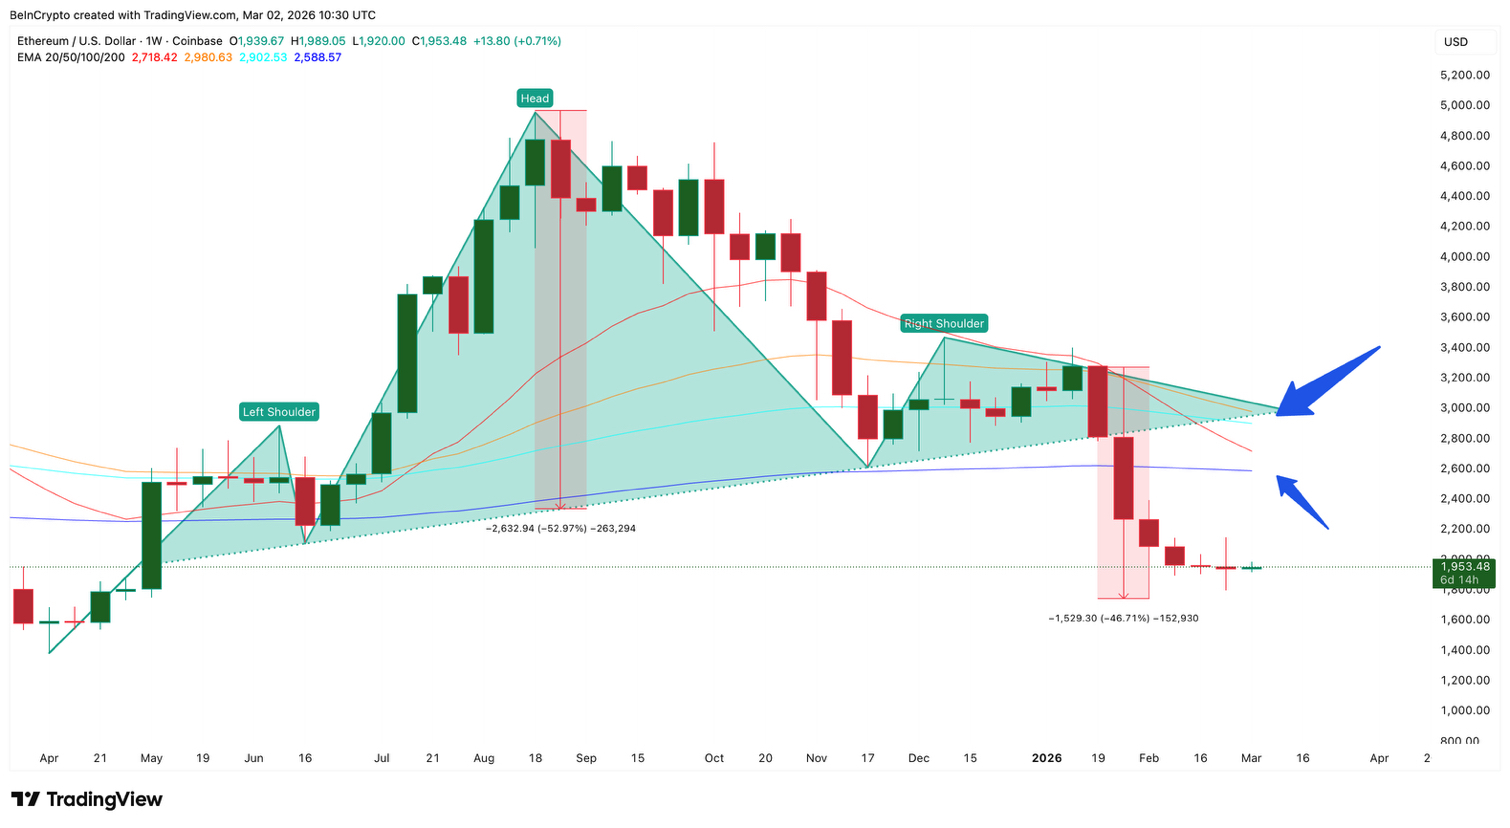
· Analyst Outlook: Analysts are split. Some view the record staking and supply crunch as a slow-burning catalyst for a future rally once the macro environment stabilizes . Others warn that the breakdown below $2,000 could trigger a head-and-shoulders pattern targeting lows near $1,320 .
Conclusion
The ETH chart currently paints a picture of a market under pressure. While the structural supply story (staking and exchange outflows) is profoundly bullish for the medium to long term, it is currently being overpowered by weak short-term demand, ETF capital flight, and macro uncertainty. Until ETH can reclaim the $2,150 level with conviction, the path of least resistance remains to the downside, with $1,800 as the next major line of defense.
Note: This analysis is for informational purposes only and does not constitute financial advice. Cryptocurrency markets are highly volatile; always conduct your own research before investing.