BTC/USDT analysis on Heikin Ashi candles 📊
Based on the current chart, here is the analysis according to Heikin Ashi candle logic:
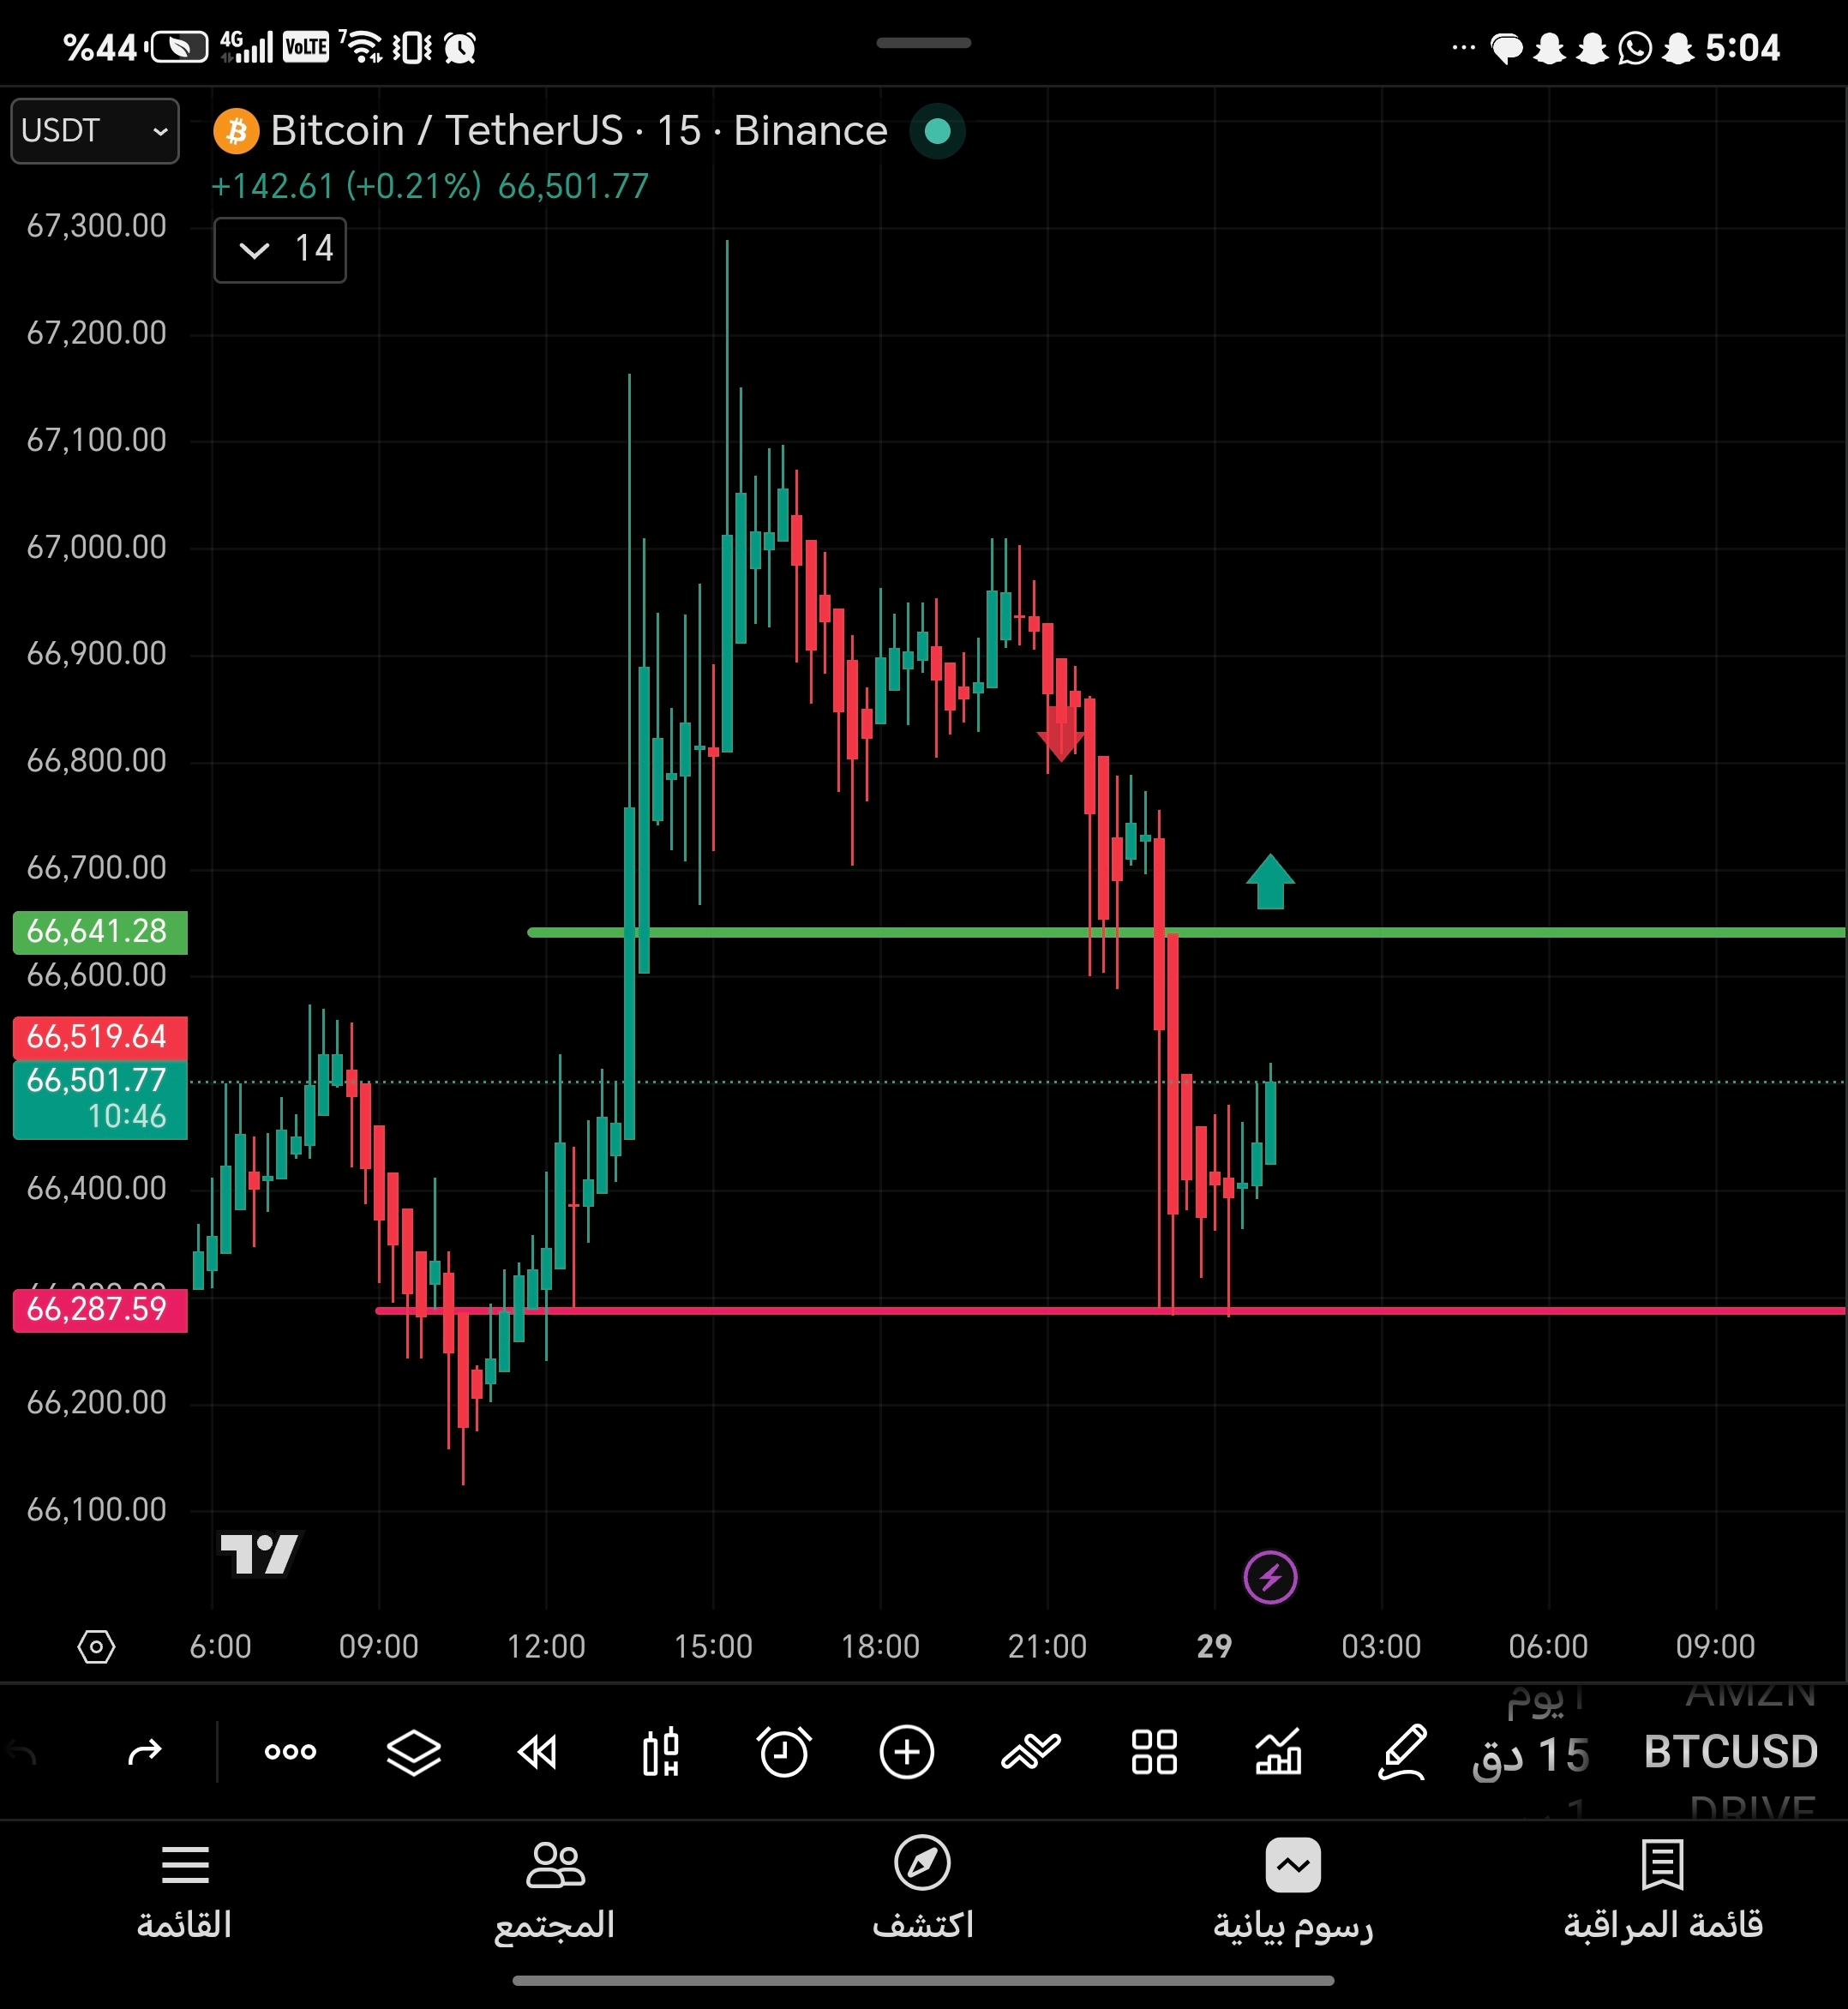
The bullish scenario (Bullish) 🟢
**Condition:** A green candle appears **above the green line** (66,641.28)
When this condition is met, there will be confirmation to enter a strong buy trade.
Target and stop levels:
| Level | Price | Type |
|--------|------|-------|
| **Stop Loss** | **66,287.59** | 🛑 |
| **Target 1** | **66,641.28** | ✅ |
| **Target 2** | **66,800.00** | ✅ |
| **Target 3** | **67,000.00** | ✅ |
| **Target 4** | **67,200.00** | 🎯 |
Analytical Notes:
1. **Entry Point**: A green candle closes **above 66,641.28** (the green line)
2. **Distance to Stop**: ~354 points
3. **Risk Ratio**: The targets provide a gradual escalation with good protection
4. **Red Line** (66,287.59): Represents an important secondary support