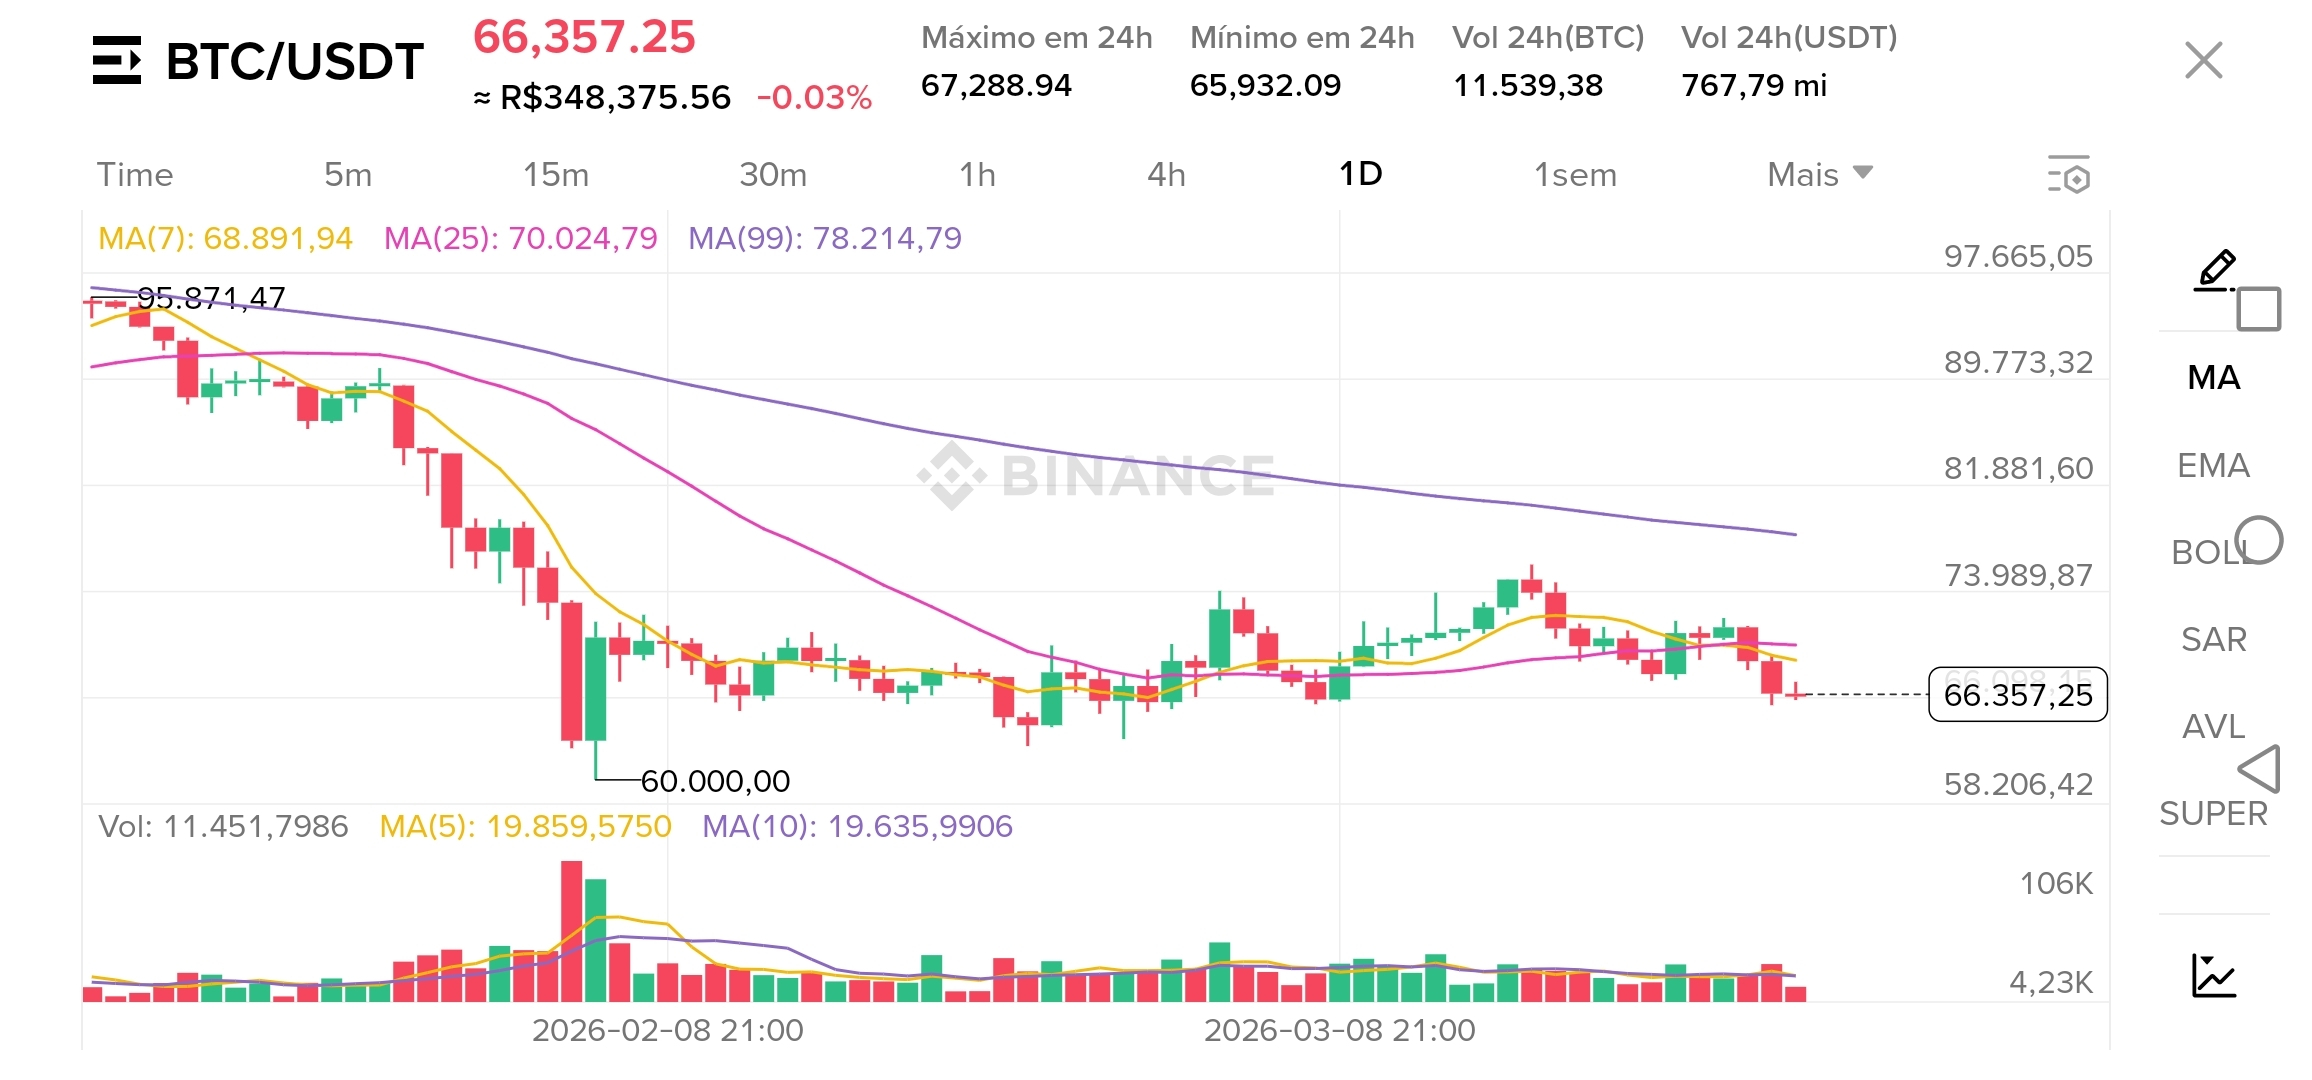
The scenario for Bitcoin ($BTC ) on the daily chart has triggered the yellow signal! ⚠️ Currently priced at 66,357, the king of cryptos is struggling not to give up more ground to the bears.
What is the chart telling us? 📊
Pressure from Averages: We are operating below the averages of 7, 25, and 99 days. This indicates that the short and medium-term trend is DOWN. As long as we do not recover 70,000, the bias remains bearish.
Danger Zone: The support at 60k is our main line of defense. If we lose this level, the plunge could be deeper.
Iron Resistance: The 68.8k region (MA7) is acting as a tough ceiling to break.
Trader's Verdict:
At the moment, the market is "heavy". For those who are long, caution is the watchword. Waiting for a reversal signal or a successful test of the 60k support could be the safest strategy. 🛡️
And you, do you believe in a bounce now or will we test 60k again? Leave your opinion in the comments! 👇
#BTC #Bitcoin #CryptoAnalysis #Trading #BinanceSquare #Bearish #TechnicalAnalysis $BTC #BitcoinPrices #OilPricesDrop #TrumpSeeksQuickEndToIranWar #TrumpSaysIranWarHasBeenWon #US5DayHalt