The HYPE/USDT pair shows an ideal technical pattern reflecting a shift in direction from a downward trend to a strong upward movement after a period of consolidation within a narrow channel.
Technical Analysis:
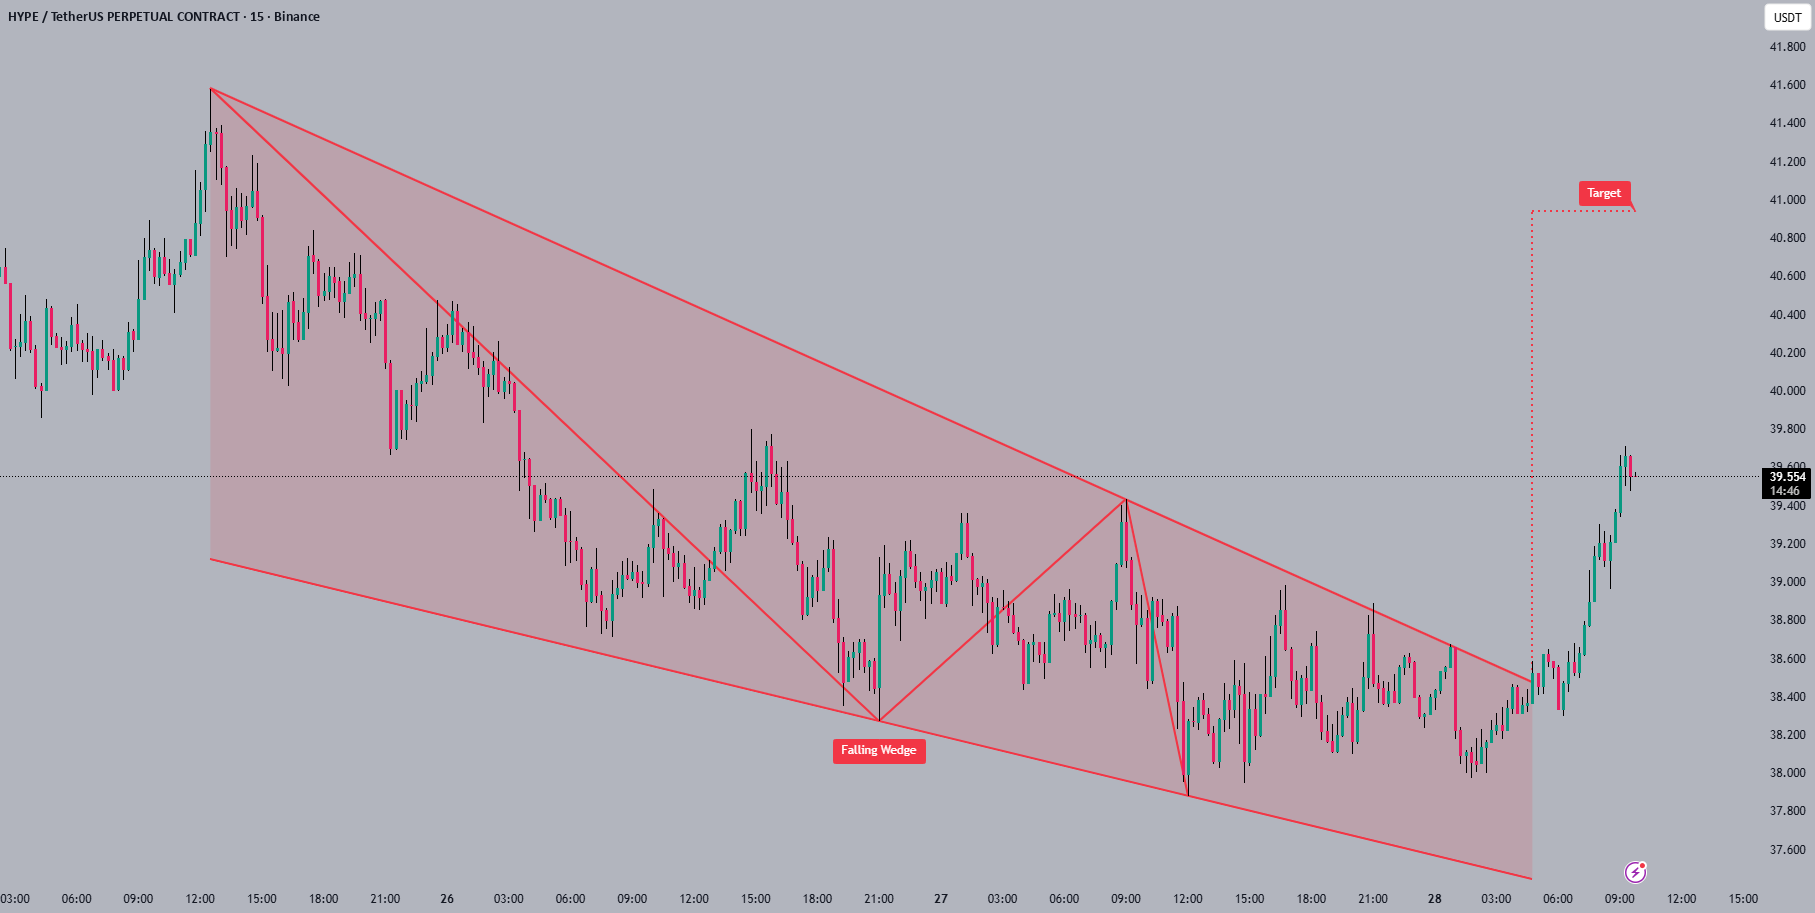
The pattern (Falling Wedge): the price was moving within a "descending wedge" (shaded in red), which is a bullish reversal pattern that often ends with a price explosion upwards once the ceiling is broken.
Breakout: We observe a successful and confirmed breakout of the wedge ceiling at approximately 38.40, followed by a sharp and continuous rise that confirms the strength of the buying momentum.
Current momentum: The price is now trading at levels 39.55, with strong green candles indicating that buyers are targeting higher resistance areas.
Potential price targets:
Main target: Based on the measurement of the model's height, the technical target is at levels 40.90 - 41.00 (as indicated by the red dashed line), which is the peak from which the bearish model started.
Trading strategy:
Entry: The trade is currently in the profit-taking phase; if you are out of the market, it is advisable to wait for a slight retest of the 39.00 levels before entering.
Risk management: It is advisable to set a stop loss below the last breakout area (around 38.20) to secure the trade from any sudden fluctuations.
Do you think that $HYPE will reach its target at 41.00 before the end of today's trading? Share your view! 👇
#hype #CryptoAnalysis #FallingWedge #TradingSignals #BinanceSquare