The crypto market had a rough week. After months of choppy trading, Bitcoin slipped below the $87,000 mark earlier this week - a level many traders were watching closely as short-term support.
Key Takeaways
Bitcoin lost the $87K level mid-week, dragging altcoins lower across the board
All five tokens posted weekly losses between 14% and 21%
RSI readings near or below 30 signal oversold conditions for most
Some tokens carry positive fundamental developments despite the price drop
Broader macro uncertainty continues to weigh on risk assets
The move triggered a wave of selling across the altcoin market, with smaller-cap tokens absorbing the worst of the damage. Nothing unusual about that playbook. When Bitcoin sneezes, altcoins catch pneumonia.
What made this week's selloff sting a bit more is that it came despite some genuinely interesting fundamental developments for several of the hardest-hit tokens. Markets, as always, didn't care.
Here's a breakdown of the five biggest weekly losers and what's actually going on with each of them.
1. ether.fi (ETHFI)
Price: $0.4674
7-day change: –21.46%
Market cap: ~$368M
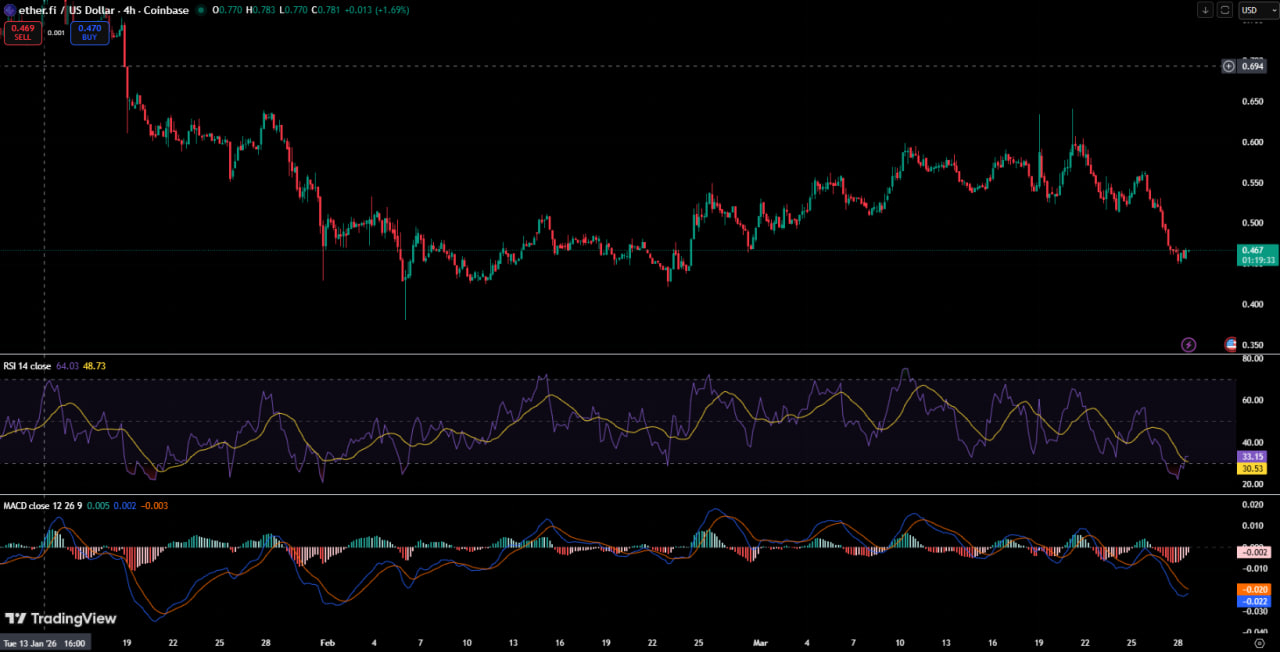
ETHFI took the biggest hit of the group this week. The liquid restaking protocol had some genuinely positive news cycle - South Korea's Upbit exchange added an ETHFI/KRW trading pair on March 19, which briefly sent prices up 12–20%. That move evaporated fast. The protocol is also mid-migration, shifting its "ether.fi Cash" payment card service from the Scroll blockchain over to Optimism's OP Mainnet to handle heavier transaction volume. On top of that, a $50 million treasury buyback program is active, with the protocol buying back ETHFI whenever the price sits below $3. Spoiler: it's sitting well below $3.
The 4-hour chart shows a prolonged downtrend from around $0.78 back in January to current levels near $0.47. RSI is hovering around 33, which puts it just above oversold territory. The MACD is negative but the histogram bars are shrinking - that sometimes signals the selling pressure is thinning out. Not a green light, but worth watching. No clear support floor has formed yet.
2. Kite (KITE)
Price: $0.1726
7-day change: –20.77%
Market cap: ~$311M
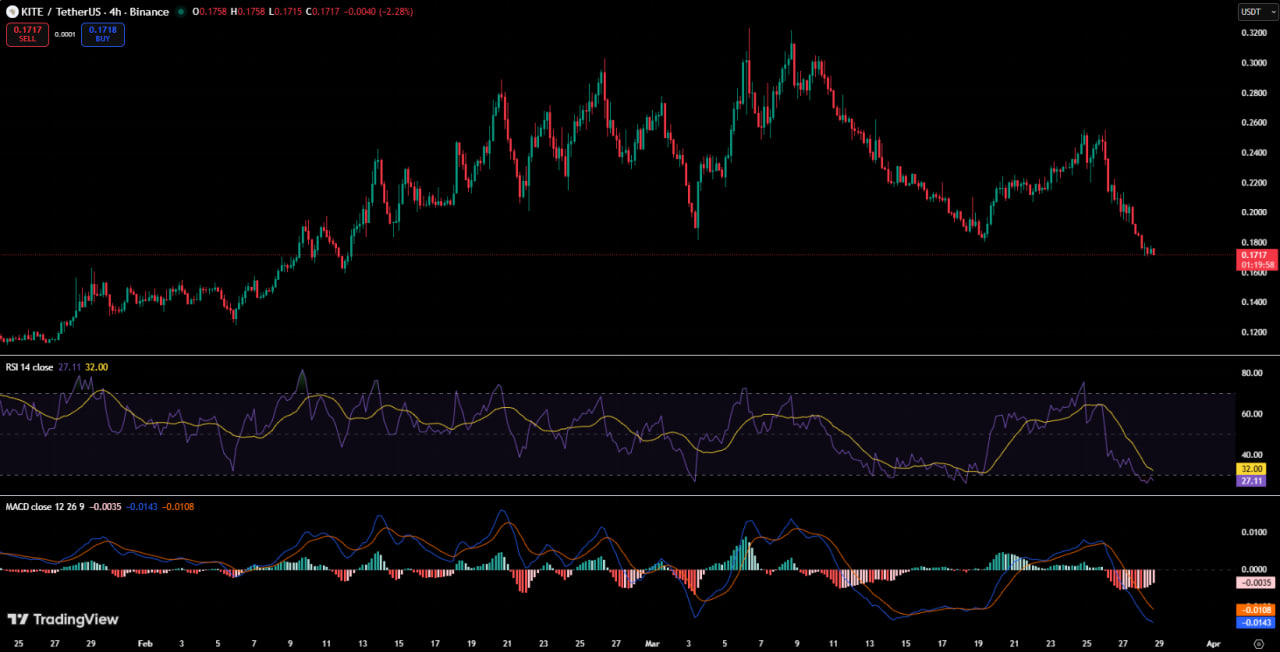
KITE is an AI-focused Layer-1 blockchain project building on top of Avalanche, and it's been one of the more talked-about smaller tokens in the AI narrative space. Its mainnet launch is targeting Q1 2026, and the team kicked off a global hackathon with Encode Club on March 24 to attract developers to its so-called "agentic economy" - essentially an ecosystem designed around autonomous AI agents. Earlier in March, KITE was actually highlighted as one of the few tokens trading closer to its all-time high than Bitcoin. That didn't last long.
The 4-hour chart tells a clean story: a strong rally from late January through early March, peaking around $0.32, followed by a sharp reversal. KITE is now trading near its pre-rally base. RSI has dropped to around 27 on the fast line - that's firmly in oversold territory. MACD is negative and still declining. Think of RSI like a rubber band: the more stretched it gets in one direction, the more likely it snaps back - but "likely" doesn't mean "soon."
3. Decred (DCR)
Price: $20.98
7-day change: –16.99%
Market cap: ~$364M
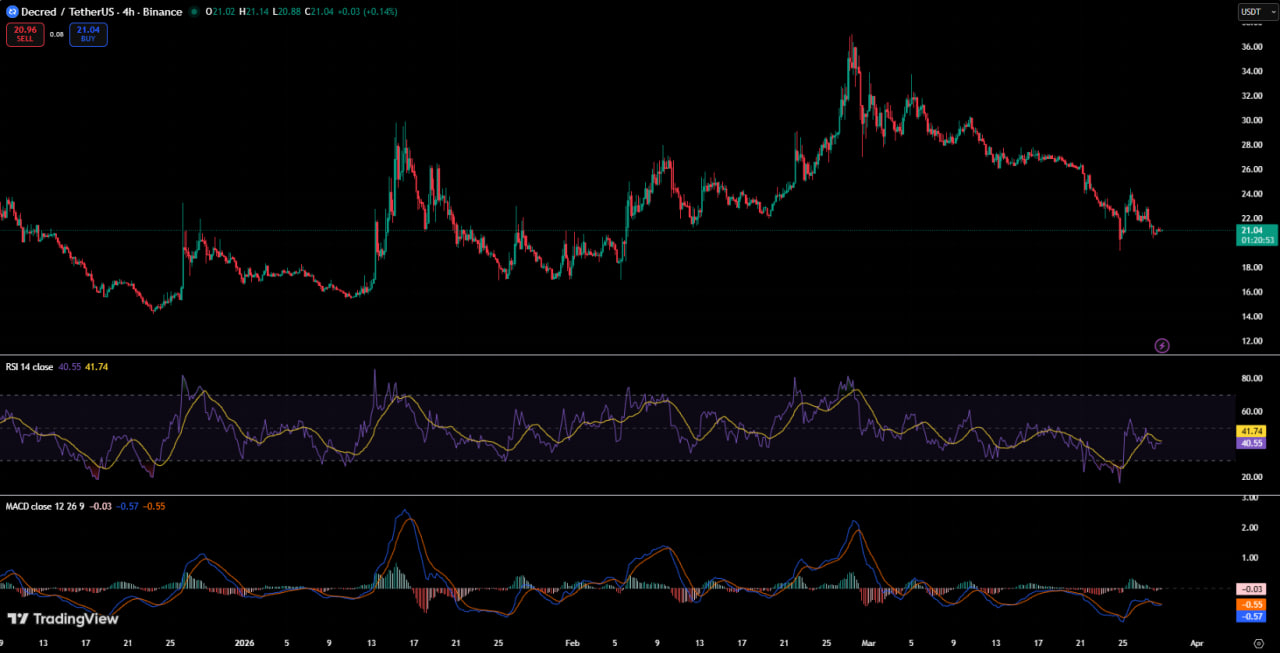
Decred is one of the older, quieter corners of crypto - a hybrid proof-of-work/proof-of-stake chain with a serious on-chain governance system. This week it passed proposal DCP-0013, raising the treasury spending cap to 4%, which gives the community more flexibility in funding development. DCR also picked up some renewed attention earlier in 2026 as part of a broader privacy coin narrative, with around 72% of its circulating supply currently locked in staking. Analysts have been pointing to a rising channel pattern on the weekly chart with a potential target of $38–$45 if support holds. That target looks a long way from here right now.
The 4-hour chart on the Binance USDT pair shows a clean peak around $35 in early March, followed by a steady grind lower. DCR is back to levels it was trading at before the February–March rally. RSI sits at about 40 - not oversold, but trending lower. MACD is negative with both lines pointing down. There's no obvious bounce signal here yet. Previous support around $20–$21 is being tested right now, so this zone is key to watch.
4. Morpho (MORPHO)
Price: $1.49
7-day change: –16.93%
Market cap: ~$605M
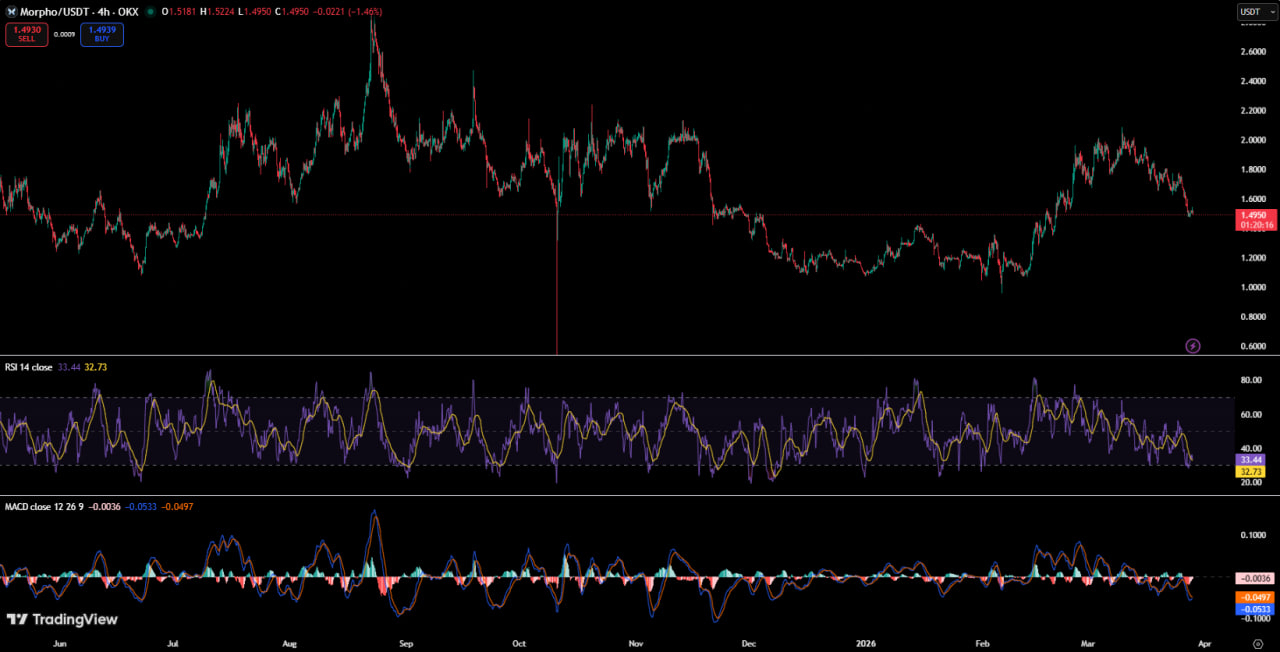
Morpho is a DeFi lending protocol that's been steadily attracting institutional interest. In February, Apollo Global Management announced a strategic plan to acquire up to 9% of the total MORPHO supply over 48 months. Mid-March, the Ethereum Foundation deployed an additional 3,400 ETH into Morpho vaults — a notable vote of confidence. The protocol is also rolling out Morpho V2, which introduces fixed-rate and fixed-term loans aimed squarely at institutional DeFi adoption. Heavy hitters are clearly paying attention. The market isn't, at least not this week.
The longer-term OKX chart shows MORPHO had a significant rally from around $1.20 in late 2025 up toward $2.00 in February 2026, only to give most of it back. It's now back near the $1.49 area. RSI is sitting at 33 - close to oversold. MACD is negative. The key level to watch is the $1.20–$1.25 range, which acted as a floor during late 2025. If that breaks, there's not much obvious support below it.
5. Polkadot (DOT)
Price: $1.28
7-day change: –14.44%
Market cap: ~$2.15B
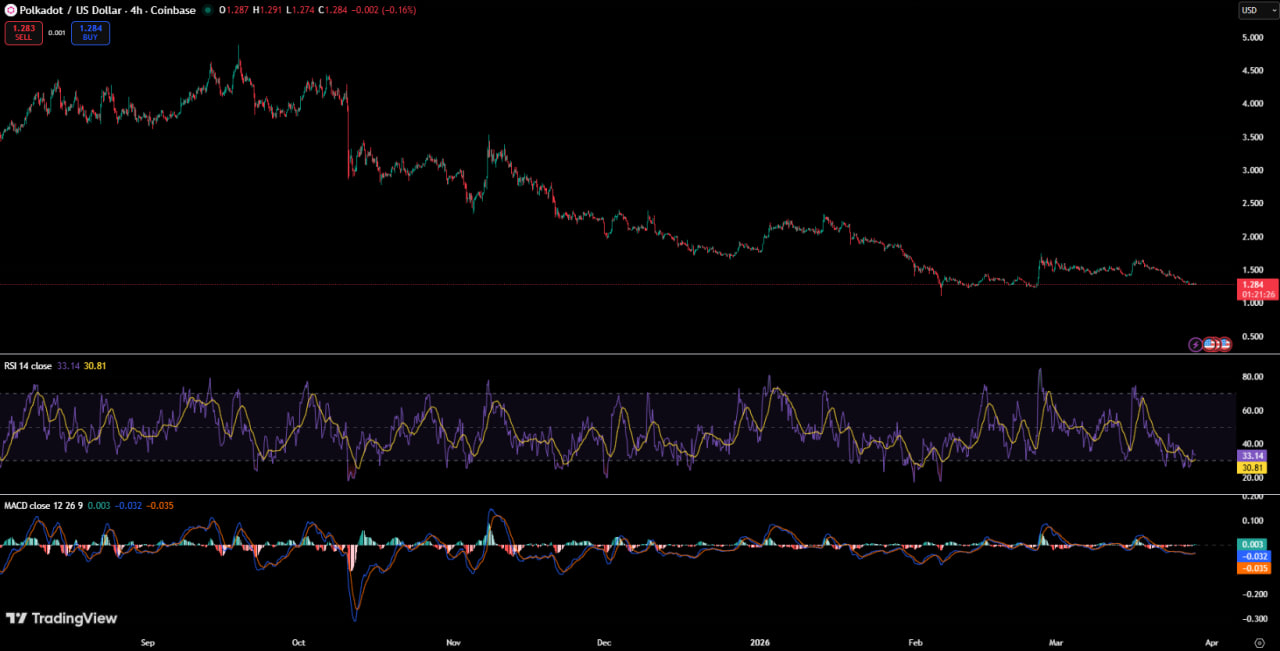
Polkadot had what should have been a landmark few weeks. On March 14 - Pi Day - the network implemented its most significant economic overhaul to date, introducing a hard supply cap of 2.1 billion DOT and slashing annual token issuance by roughly 54%, from 120 million down to around 55–56 million DOT per year. The unbonding period for stakers was also cut from 28 days to just 24–48 hours, a major improvement for capital efficiency. And on March 6, the first U.S.-listed Polkadot ETF - TDOT by 21Shares - started trading on Nasdaq. By almost any measure, that's a strong fundamental week. The price is down nearly 15% anyway.
The 4-hour Coinbase chart shows DOT in a prolonged downtrend stretching all the way back to September 2025, when it was trading near $4.50. It's been a slow, painful bleed. RSI is around 33 — approaching oversold. MACD values are marginally negative and flat, which is at least better than sharply declining. DOT is approaching multi-year lows. The $1.20 area will be the next line in the sand.