
$BTC “Most traders are bullish on BTC right now… but here’s what they’re missing 👇
🔥 BTC TOP-DOWN ANALYSIS – BEARISH BIAS EXPLAINED.
Many traders see a bullish yearly structure on BTC, but my current bias remains bearish — and here’s why.
📊 1. Higher Timeframe Perspective (1Y)
On the yearly timeframe, BTC has broken structure to the upside, confirming a bullish trend overall. However, markets don’t move in straight lines.
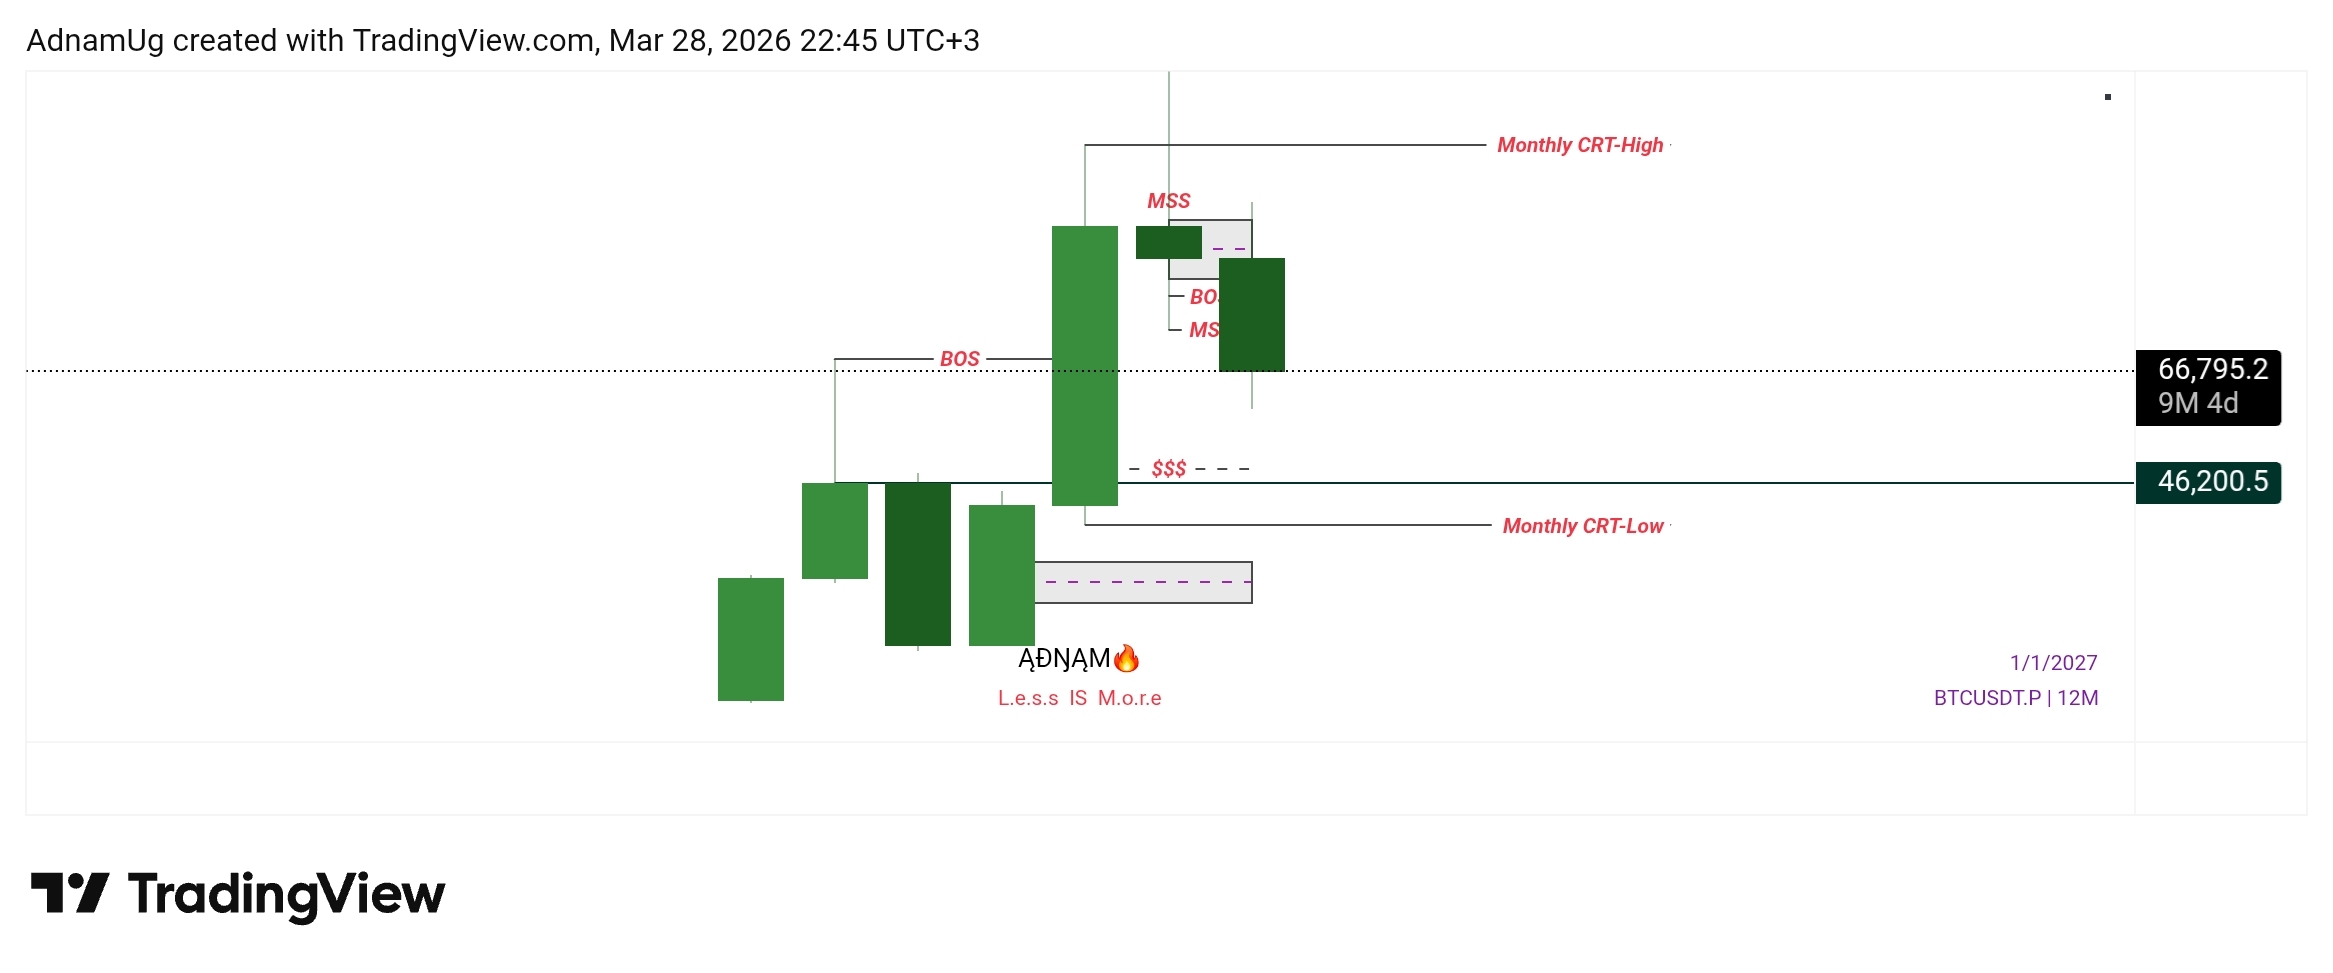
We are currently in a pullback phase of that bullish structure.
The key factor here is the formation of a CRT (Candle Range Theory), suggesting that smart money may be sponsoring a deeper retracement.
📉 2. Mid-Timeframe Insight (3M)
The 3-month candle is approaching closure and it will close in just the next 3days.
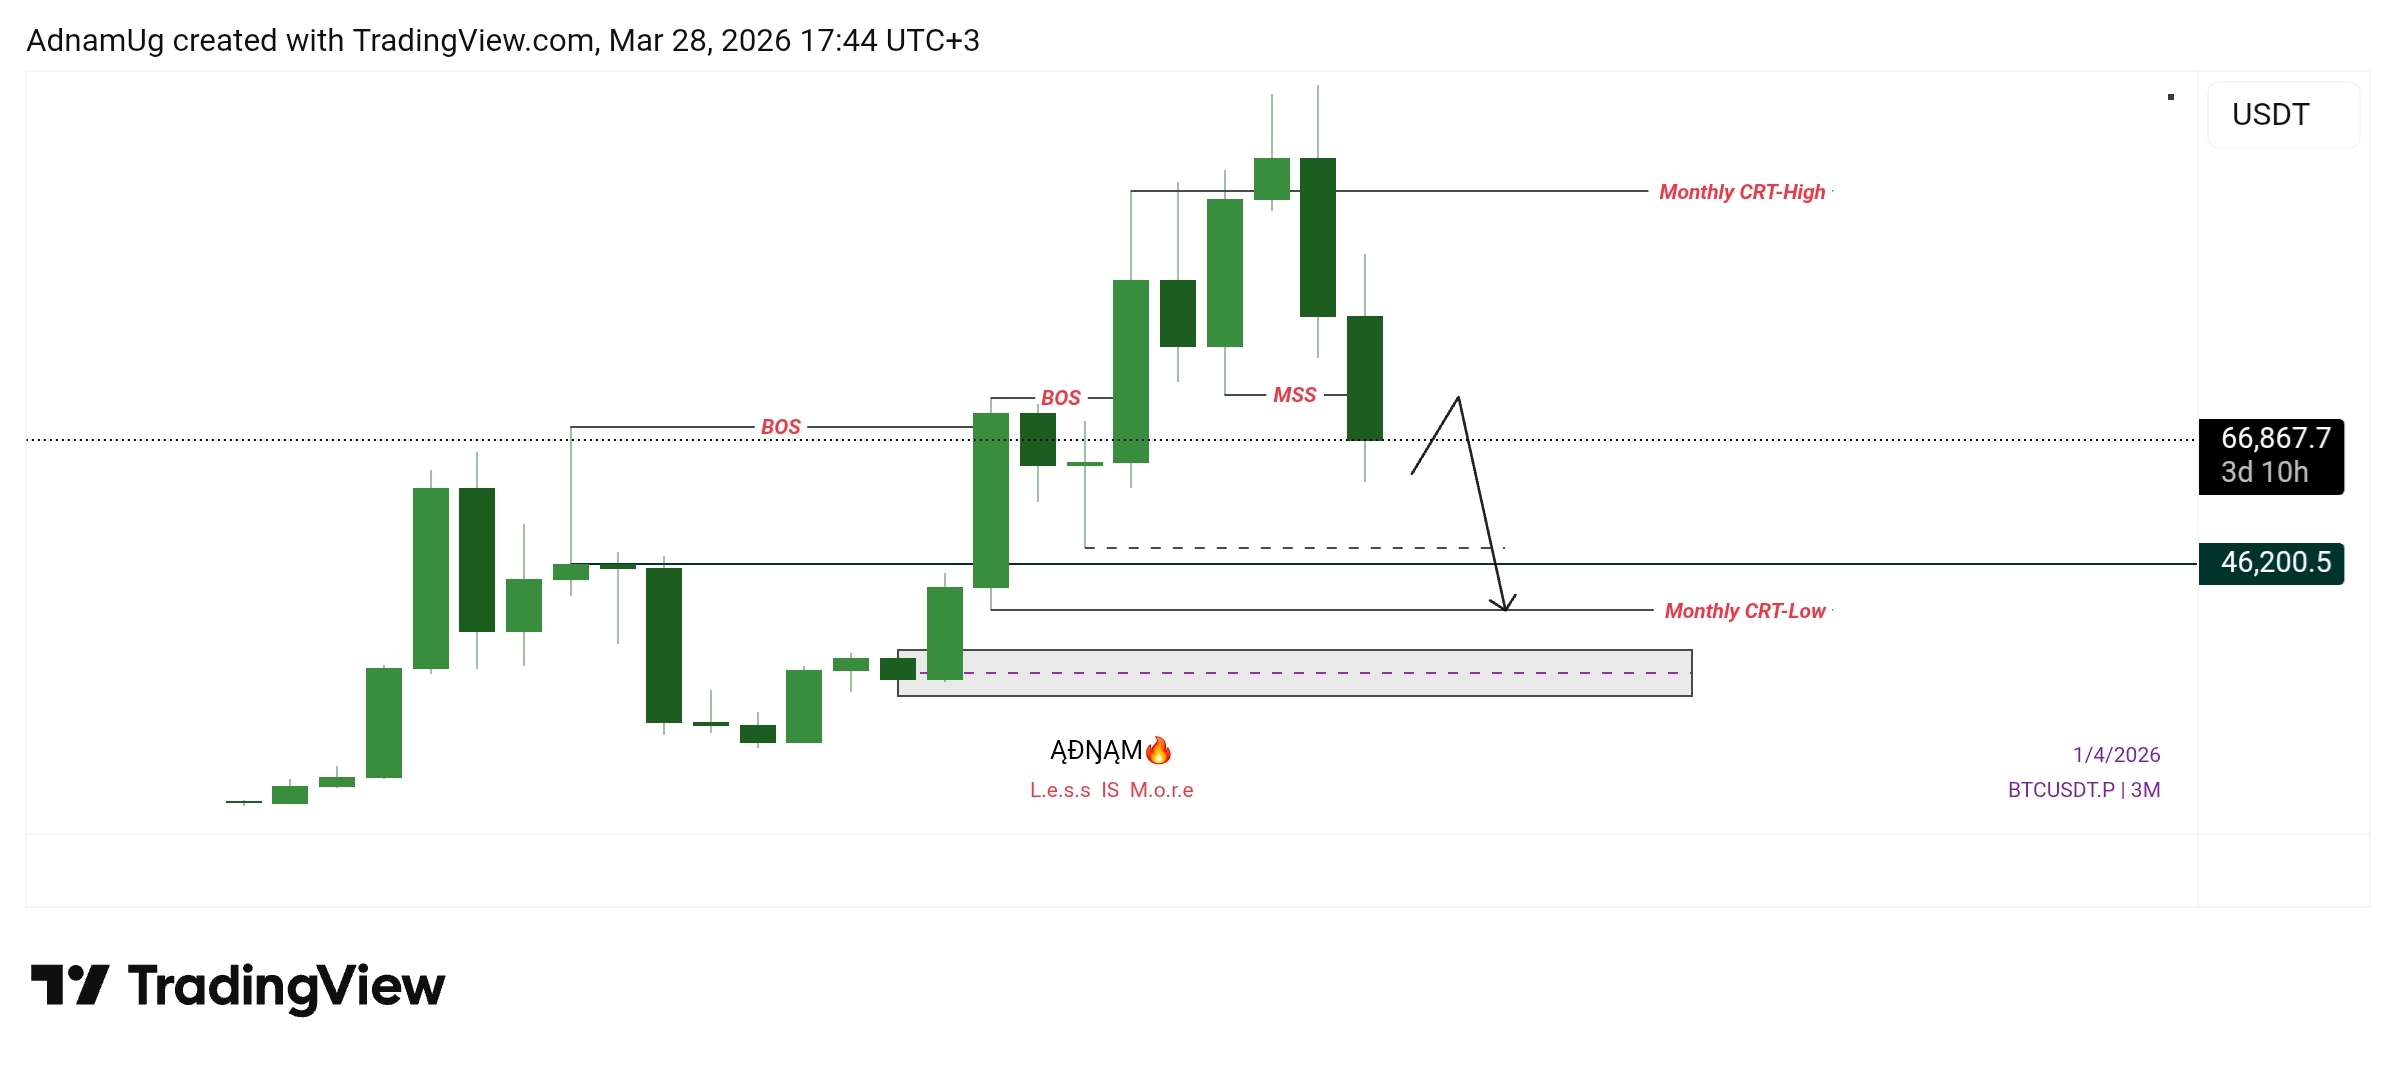
A bearish close at this level could confirm a Change in Market Structure (CHoCH), signaling increasing bearish pressure from higher timeframe participants.
📌 This aligns with a core principle:
For every Break of Structure (BOS) or Change of Character (CHoCH), we expect a pullback before continuation.
⏳ 3. Monthly Context (1M)
The monthly close will be critical.
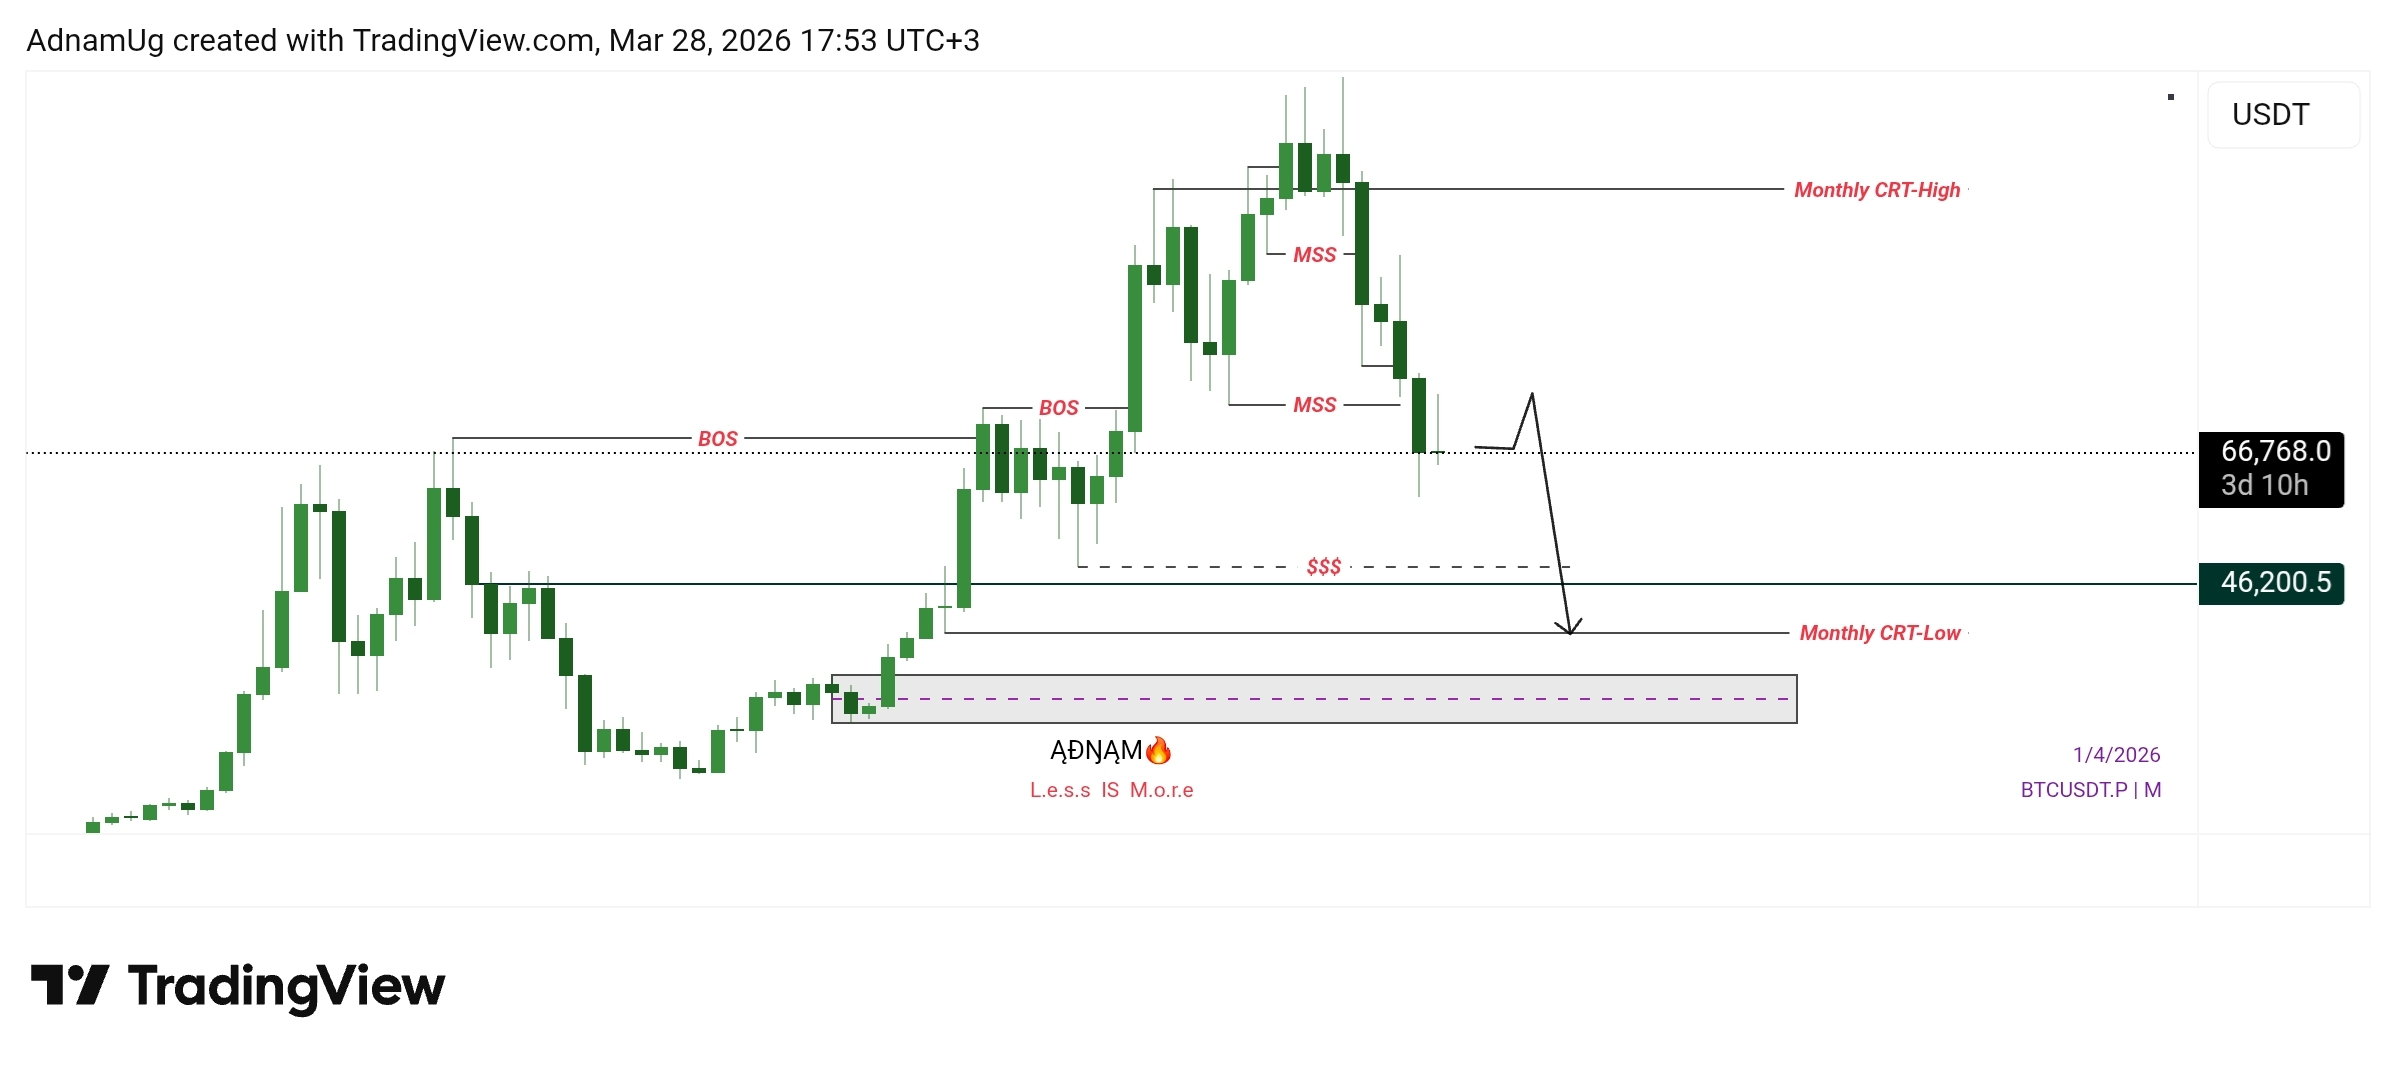
In Month of February $BTC just formed an internal market structure on which March just continued to trade within its range.
Two scenarios are likely:
• A deeper retracement into the monthly BOS zone before continuation downward
• Immediate bearish continuation without significant pullback
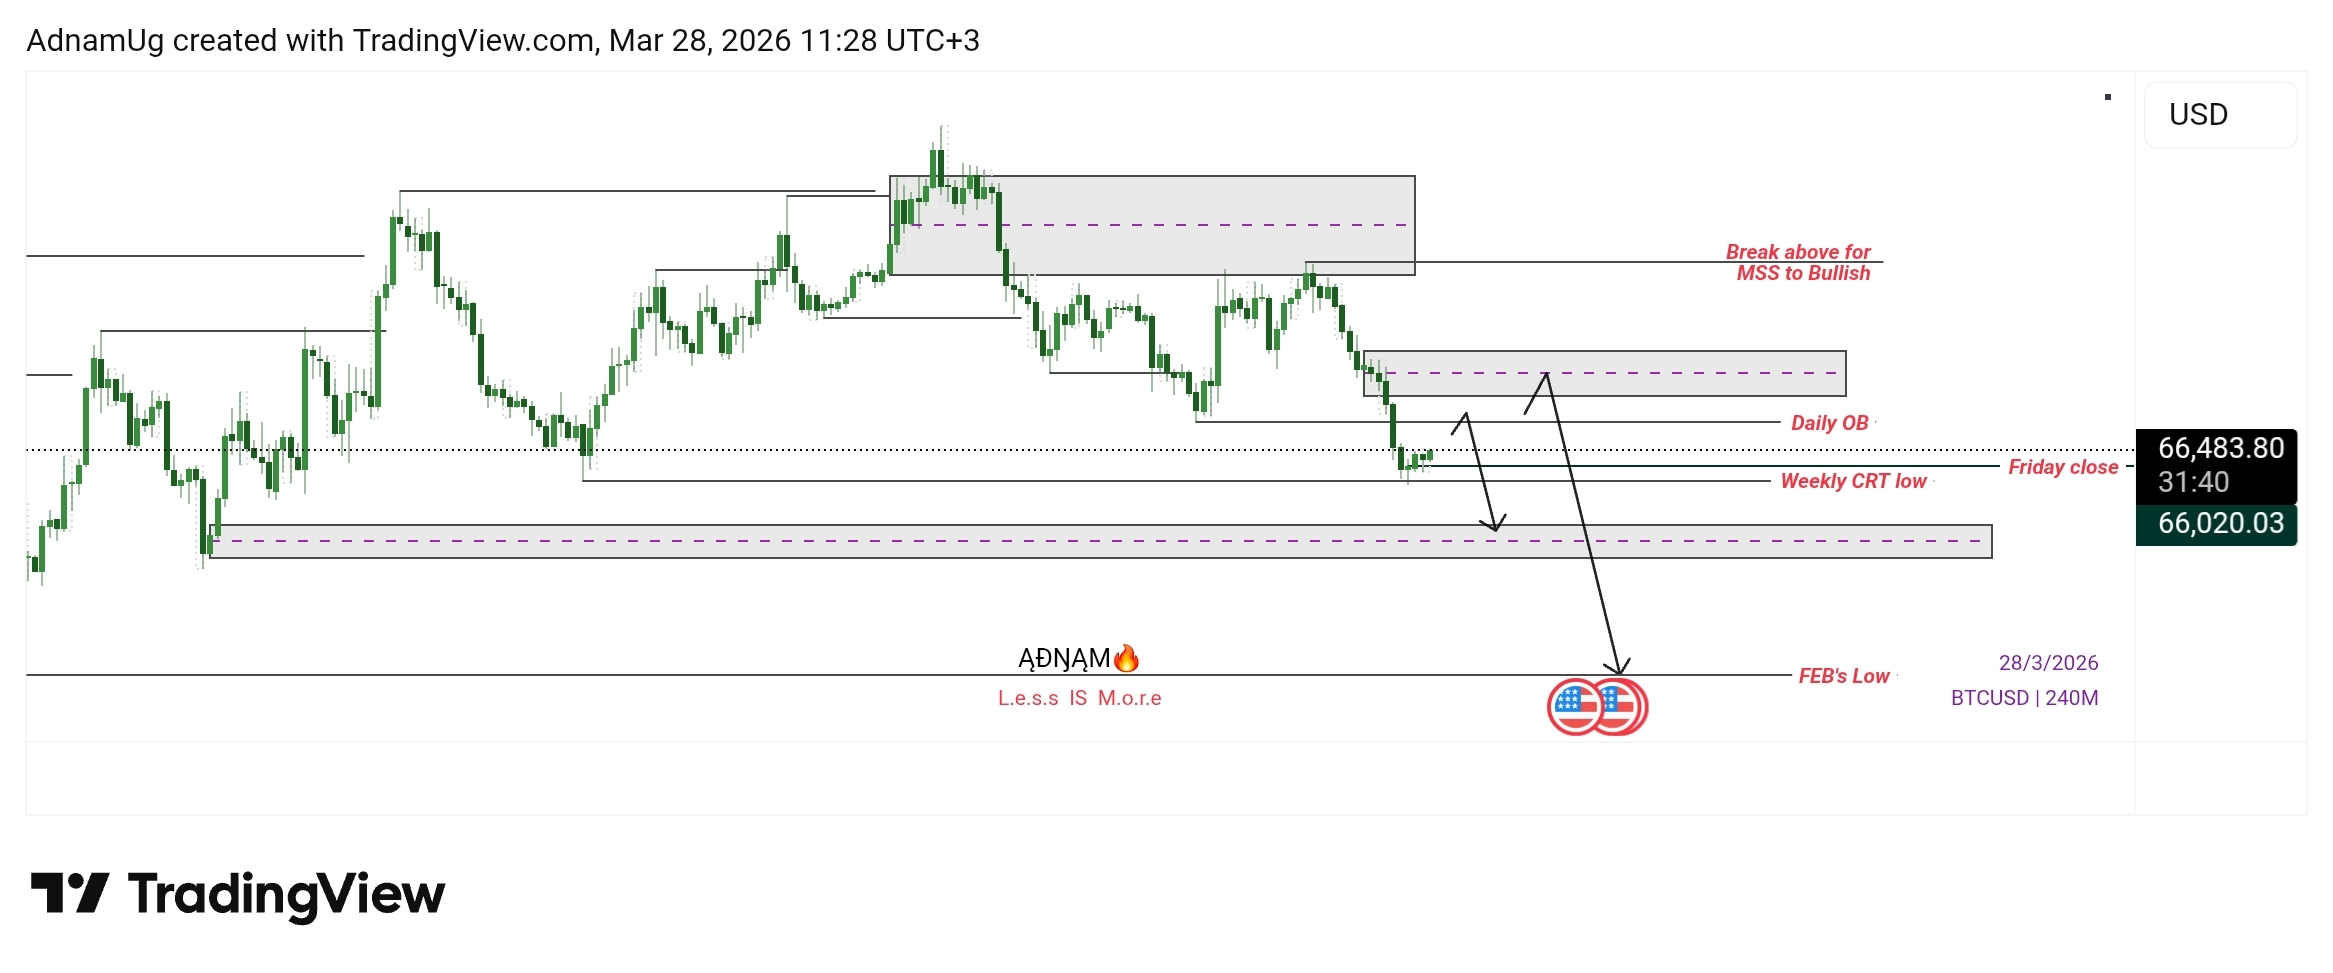
📉 4. Lower Timeframes (W, D, H4)
Lower timeframes are already showing signs of weakness, forming MSS and bearish continuations of $BTC
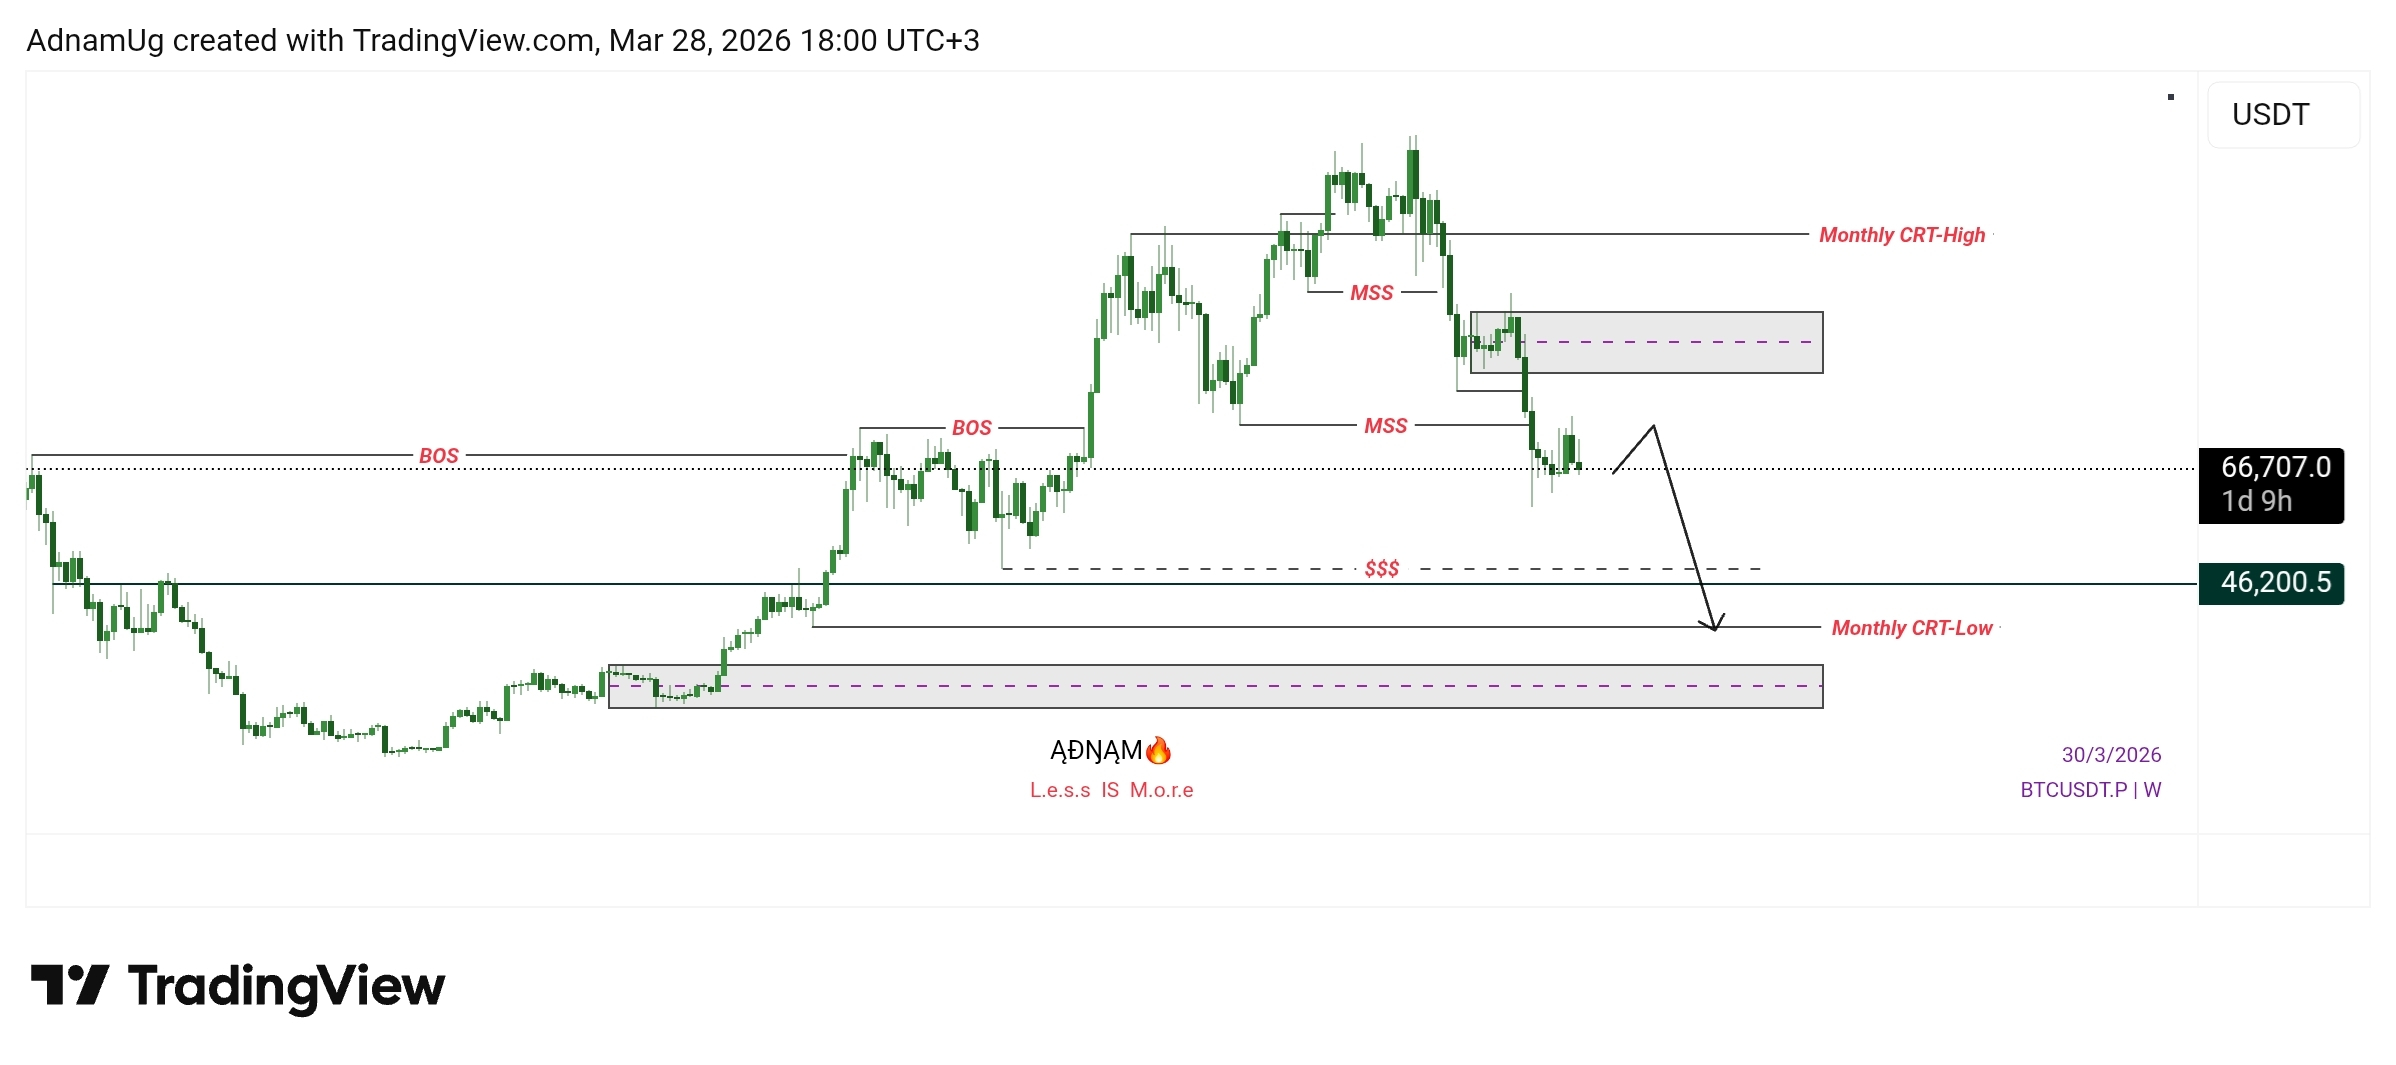
REMEMBER:
Lower timeframes move first — but higher timeframes control direction.
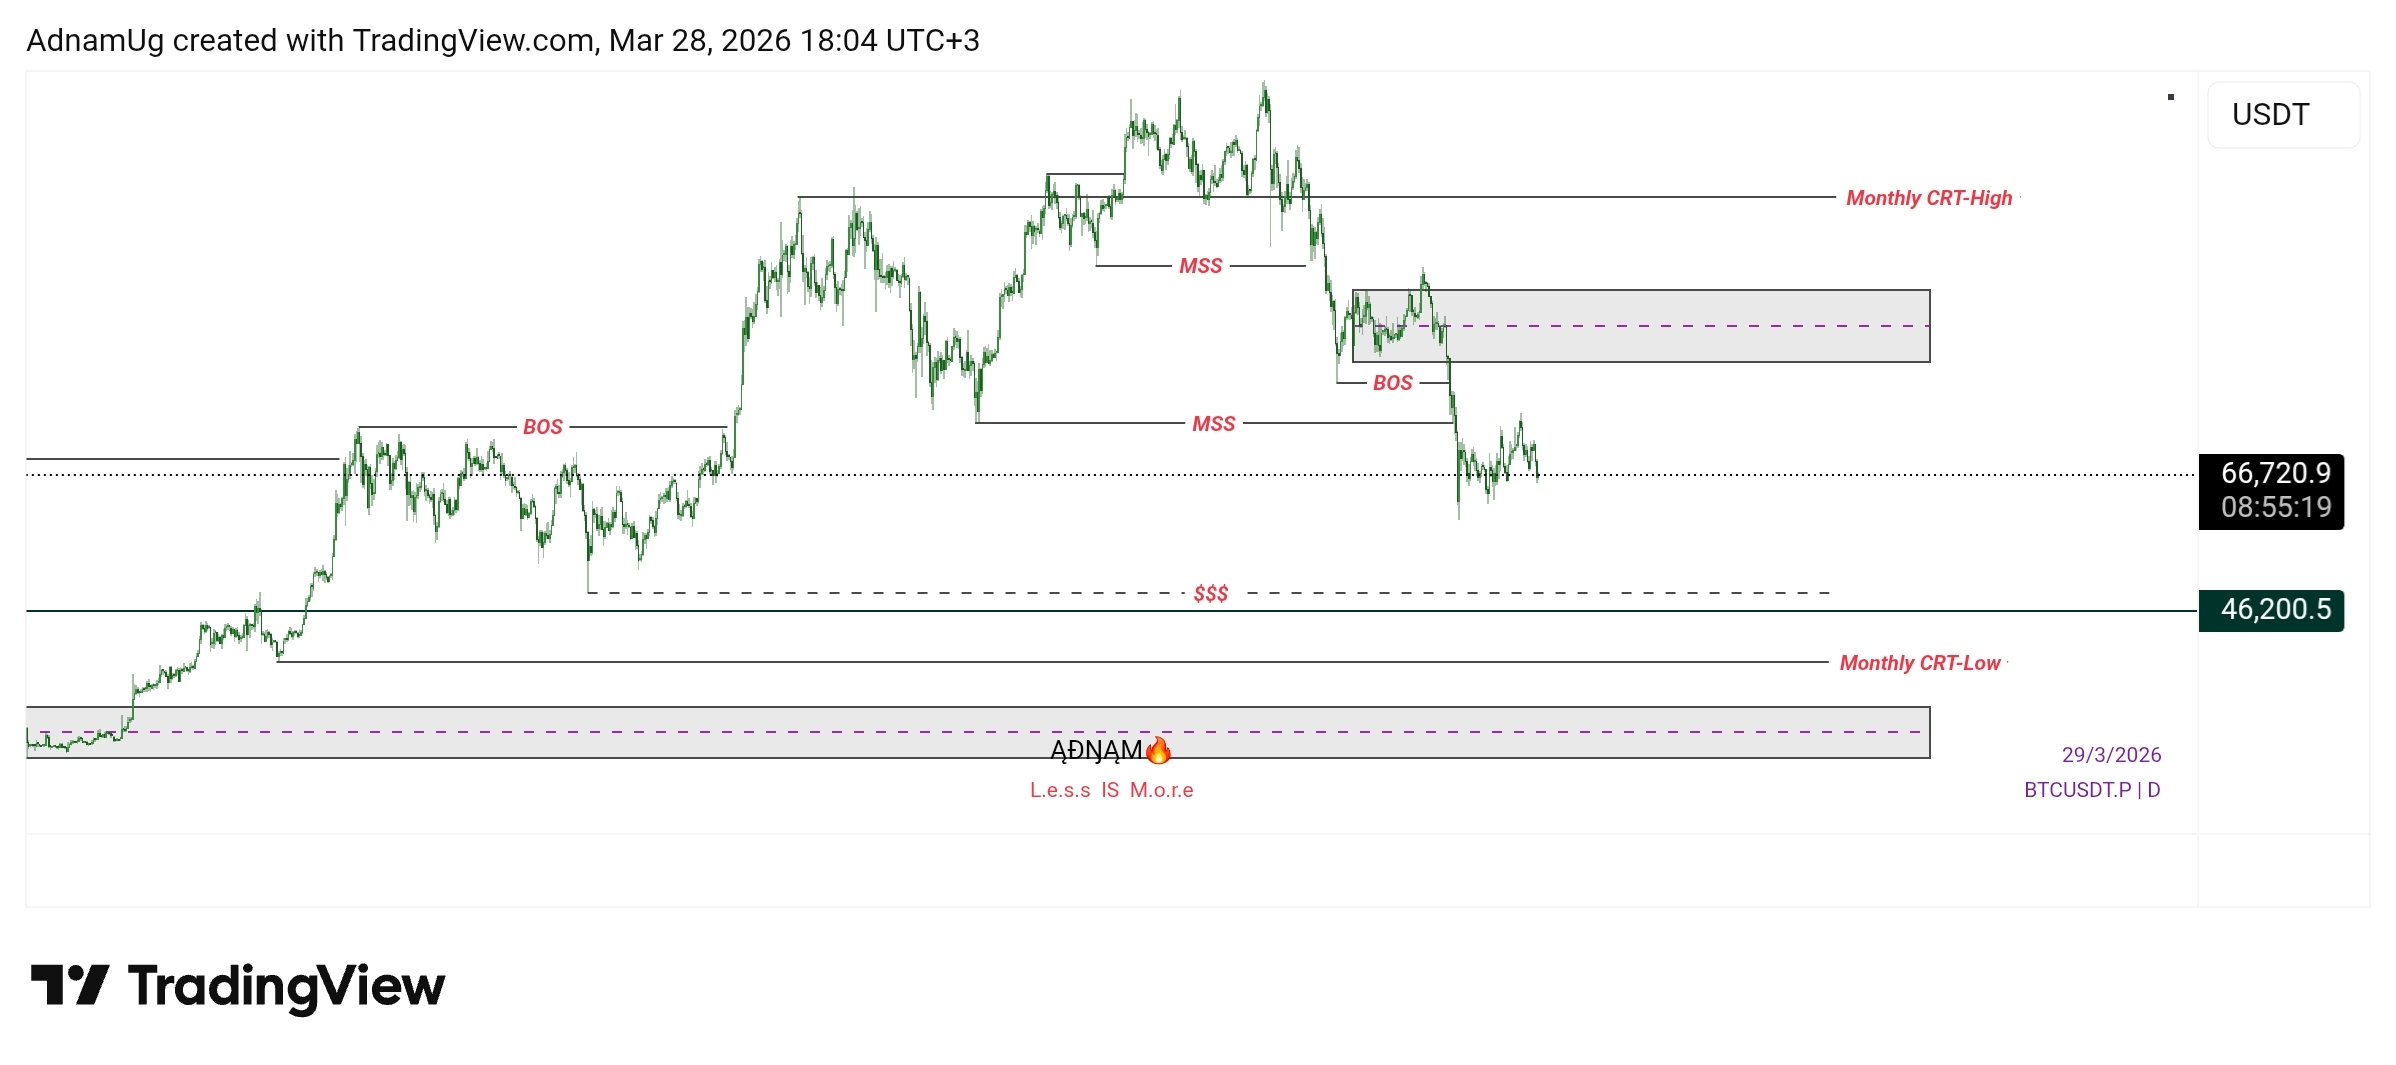
🎯 5. Overall Bias & Target
My overall bias remains bearish, targeting the Yearly CRT Low as the major objective. Although 46200 can also have bulls start to come in to push some price.
⚠️ 6. Final Note
As traders, our job is simple:
👉 React to what the market is doing
❌ Not predict based on emotions
🔥“This is not financial advice. Always manage risk.”🔥
ĄĐŊĄM ÇŔƳPŢỌ
“Less is More.” 🔥