
Brothers, just now this one-hour level big bullish candlestick that shot up, doesn't it make everyone excited?
The coin price soared all the way from around 65700, directly killing back above 67000. I see the voices of 'the bull returns quickly' and 'hurry to buy the dip or you'll miss out' flooding the square and various communities again.
But in the trading market, the most taboo thing is **'a big bullish candlestick changing beliefs'**. The more extreme the FOMO (fear of missing out) emotions are, the more we need to calm down and examine the data traces left by the main forces like top hunters.
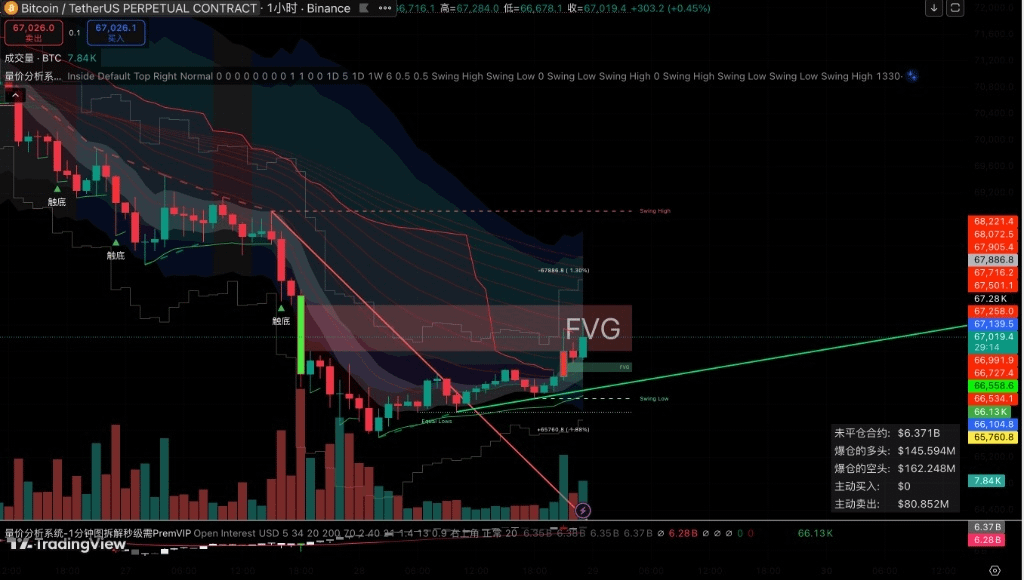
Everyone take a close look at this hourly volume-price structure chart I captured; the main force has actually revealed their cards. After reviewing these three critical details, decide whether to dive in with a full position.
Detail one: An extremely bloody 'two-way pin' washout
Don't just focus on the current rise; you need to understand how this bullish candle came about. Please everyone focus on the data statistics box in the bottom right corner of the image:
Liquidated longs: $145.594M (approximately 145.94 million dollars)
Liquidated shorts: $162.248M (approximately 162.24 million dollars)
Do you understand? This is not simply a 'bullish counterattack'; this is a textbook-level **'two-way explosion'**! The main force initially took advantage of market panic to crazily sell off and eliminate all the long positions that were holding firm at lower levels like 66000 or even lower (145.94 million dollars vanished); just when the shorts thought a trend had formed and frantically chased the market down, the main force turned around and violently pushed up, instantly blowing up the chasing shorts (162.24 million dollars lost).
This kind of up-and-down movement, which eats liquidity in both directions, indicates that the core objective of the operator at this stage is **'clearing out the high leverage on the vehicles'**, rather than truly initiating a one-sided trend.
Detail two: The mountain pressing down on the top - FVG (Fair Value Gap)
If you want to go long now, please look up at the huge red shadow box right above the candlestick chart - FVG (Fair Value Gap).
In the previous wave of intense selling, the price dropped too quickly, causing both buyers and sellers to fail to make sufficient exchanges, leaving a huge liquidity vacuum in the range of 67100 to 67800. From a technical analysis perspective, the market price has a physical attraction to fill this gap upwards; however, this FVG gap is also an extremely heavy 'supply zone (selling pressure zone)'.
Currently, this bullish candle has just precisely hit the lower edge of the FVG gap (around 67100) and encountered resistance. Above it are all the previously trapped chips and institutions' pending short orders. Without a strong breakthrough with volume and stabilizing above this red FVG box, the current rise can only be defined as **'a sharp rebound within a downtrend (filling the gap)'**, not a reversal!
Detail three: The open interest (OI) remains huge
Now look at a key data point in the bottom right corner: Open interest $6.371B (6.371 billion dollars).
After experiencing such a bloody up-and-down explosion, the contract inventory in the market still reaches 6.3 billion dollars. This means the casino is still lively, with a large number of gamblers using high leverage to compete with each other. As long as this vehicle remains heavy, it will be difficult for the main force to immediately launch a smooth one-sided bull market, and it is highly likely to continue to fluctuate in this range, washing out the unstable chips.
Hardcore trading advice from Qingfeng: What should we do now?
Based on the above market dissection, my conclusion is very clear: chasing high now has a very poor risk-reward ratio and is a typical right-side pickup.
Since we understand the market, our trading strategy is very clear:
If you are short and want to catch the bottom:
Do not enter at this awkward position (below the FVG resistance level). You have two high-probability choices:Wait for a pullback confirmation: Be patient and wait for the price to pull back again to the green moving average support below (in the range of 66000 - 66500). If it can hold without breaking the previous low (65760's Swing Low), this is called 'bottom formation confirmation', and only then is it safe to go long.
Wait for a strong breakthrough: Wait for the main force to break through the upper red FVG area with real money and volume, and test the 67800 level without breaking it, turning resistance into support. At that point, enter long on the right side and directly look at the previous high.
If you are eager to short:
The price is currently testing the FVG gap. If a 'long upper shadow' or 'bearish engulfing' appears here (in the range of 67100 - 67500) on a 15-minute or 1-hour basis, you can try a very small position for a short trade, placing the stop loss at the upper edge of the FVG. But remember, the rebound momentum has not fully exhausted; shorting is a counter-trend play, so take profits when you can.
Finally, let me leave you with a message: In the crypto market, the cost of missing out is just earning less, but the cost of picking up and reckless speculation is losing your principal. Don't let FOMO control your hands; let the bullets fly a little longer and see if the main force can digest that huge FVG gap above!
