Five months of red candles. A death cross on the weekly. Fear everywhere. But beneath the surface, one of the most historically reliable buying setups in Bitcoin's entire existence is quietly forming.
March 28, 2026
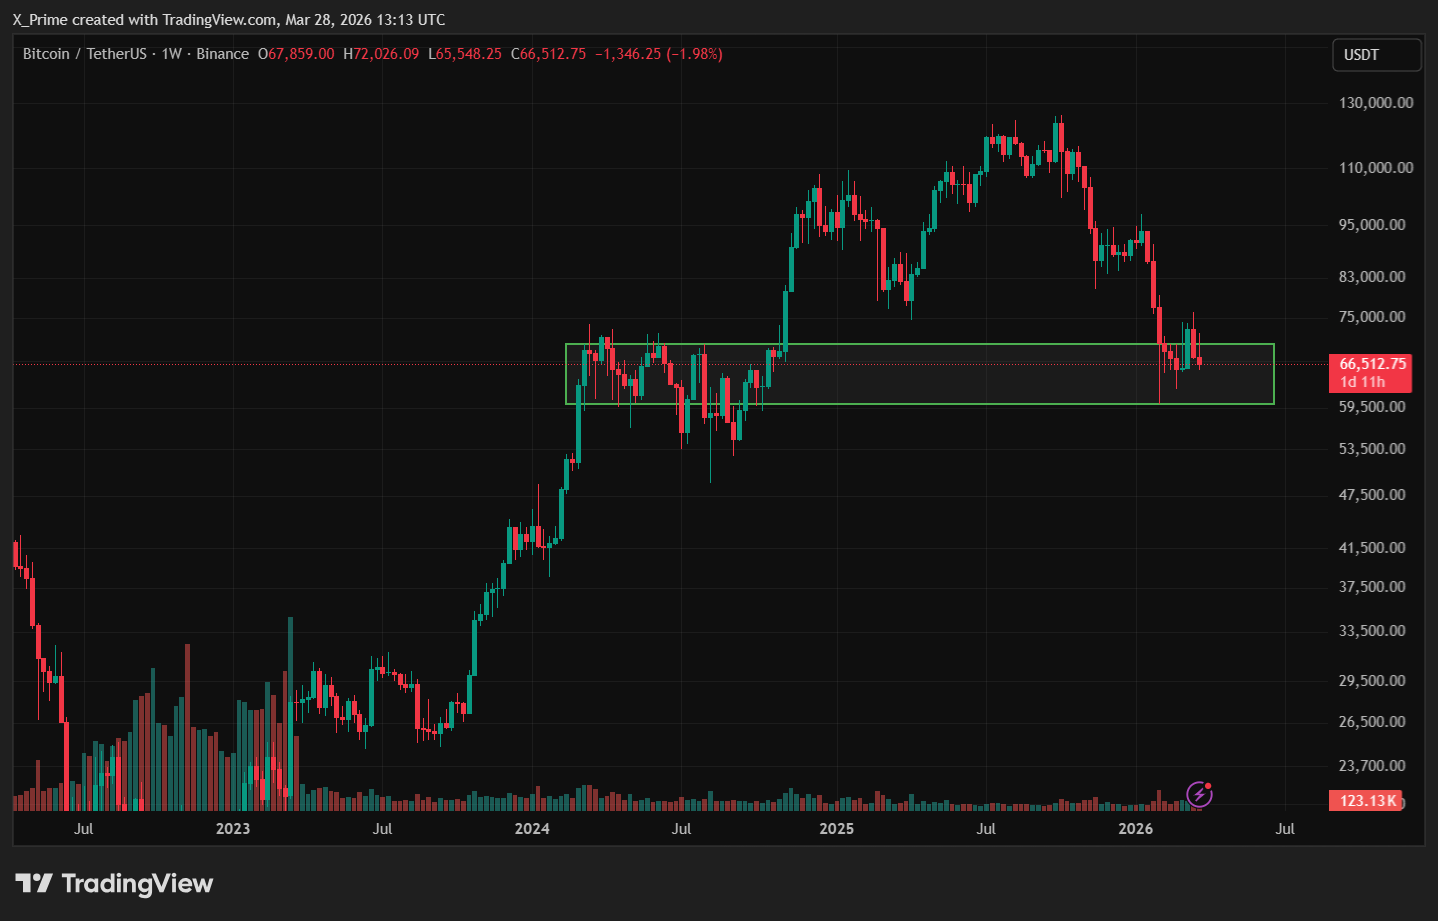
Let's be honest. If you've been watching Bitcoin's price since November 2025, it's been painful. The coin that printed a record high of $122,000 just a few months ago is now trading around $66,000 - a drawdown of nearly 46% from the peak.
The headlines are brutal. Social media is filled with doom. Influencers who were screaming $200K targets are now suspiciously quiet.
But here's the thing about fear in financial markets: it is almost always loudest right before the turn.
The Setup Nobody Is Talking About
Bitcoin's weekly RSI - a momentum indicator that measures whether an asset is oversold or overbought - recently printed one of the lowest readings in the coin's entire 15-year history.
To put that in context: there have only been two other times in Bitcoin's macro history when the RSI sustained this deep into oversold territory on a multi-week timeframe.
The first was January 2015. Bitcoin was trading near $200, down from its 2013 peak. Every analyst at the time declared the bull market dead.
Within 18 months, Bitcoin was at $20,000.
The second was December 2018. Bitcoin had collapsed from nearly $20,000 to $3,200. The word "crypto winter" was coined. Obituaries were being written.
Within 24 months, Bitcoin was printing new all-time highs at $69,000.
We are currently sitting in that same RSI territory. Right now. Today.
What the Weekly Chart Is Actually Showing
The weekly chart tells a story that the noise on social media doesn't.
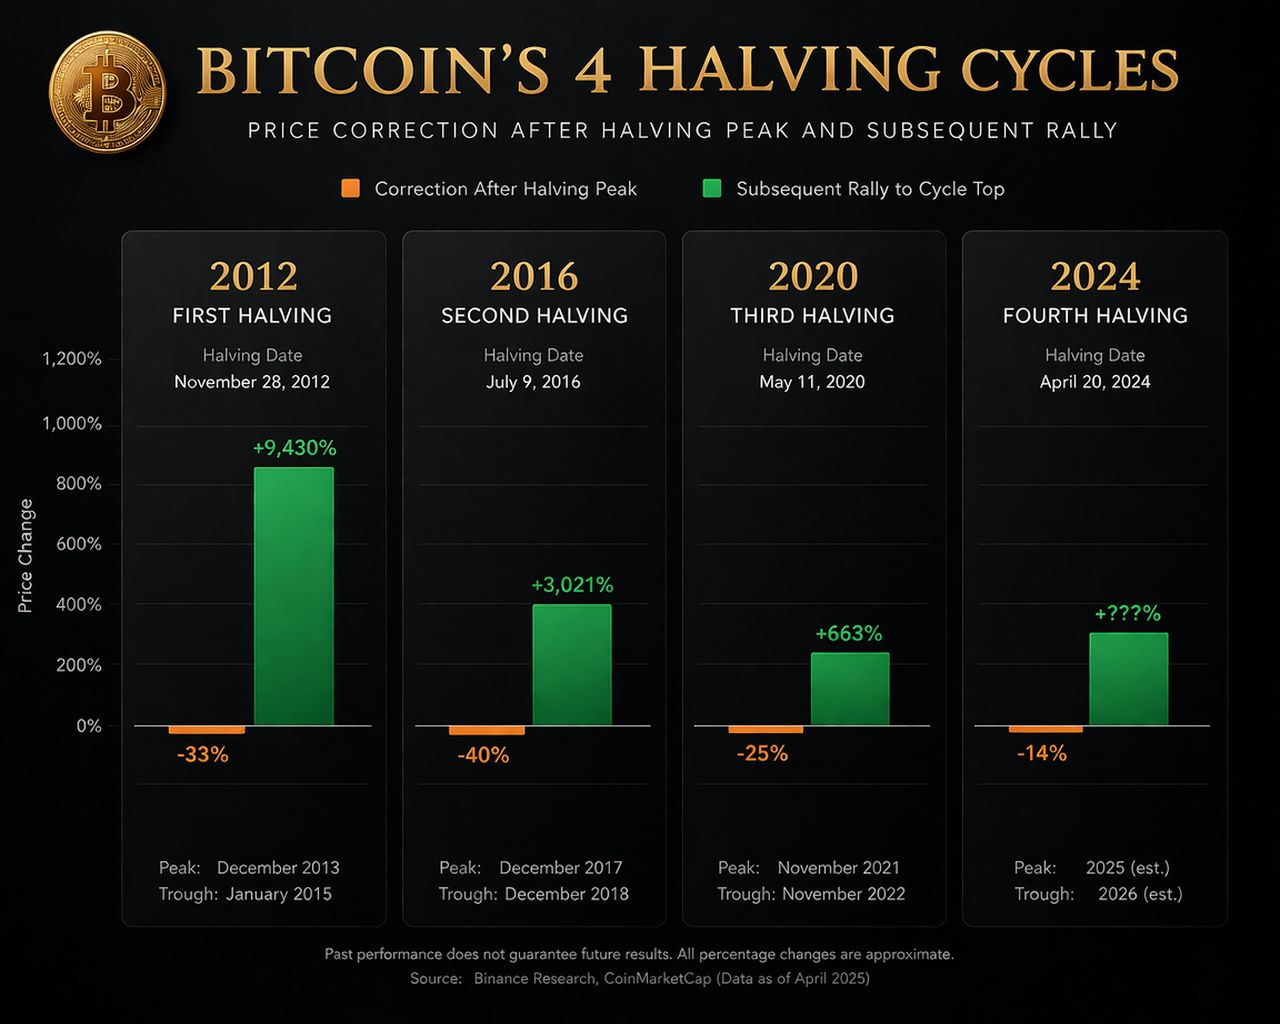
From the weekly perspective, Bitcoin's current price action is entirely consistent with a post-halving correction cycle. Every single Bitcoin halving in history has been followed by a sharp correction before the real parabolic move begins.
2012 halving → 30% correction → then 8,000% rally
2016 halving → 40% correction → then 2,900% rally
2020 halving → 60% correction → then 700% rally
2024 halving → currently in correction phase
This is not a conspiracy theory. It is a documented, on-chain verifiable pattern that plays out with remarkable consistency because the mechanics are real: miners sell to cover costs, early holders take profit, leverage gets flushed, and then the organic demand cycle resumes.
We are currently about 7 months into the post-2024-halving correction. Historically, these corrections last between 6 and 9 months before the next leg up begins.
The clock is ticking.
The Smart Money Knows Something
While retail investors have been panic selling, institutional players have been quietly doing the opposite.
On-chain data reveals that over 400,000 $BTC were accumulated between $60,000 and $70,000 during this correction phase. These are not small retail wallets. These are large entities - wallets holding more than 100 BTC - who have been systematically buying every dip in this range.
Meanwhile, spot Bitcoin ETFs - the primary vehicle through which Wall Street accesses Bitcoin - are sitting on $95.93 billion in assets under management as of March 26, 2026. That number actually increased from $91.19 billion just one month prior, indicating net inflows even as prices fell.
Institutions are not leaving. They are accumulating.
Michael Saylor, executive chairman of Strategy - the company that has made Bitcoin accumulation its core business strategy - stated publicly that 2026 is defined by banks embracing Bitcoin, with approximately half of major US banks now exploring BTC-backed loan products. The banking system itself is becoming a Bitcoin on-ramp.
This is not bearish backdrop. This is institutional infrastructure being built beneath a temporarily depressed price.
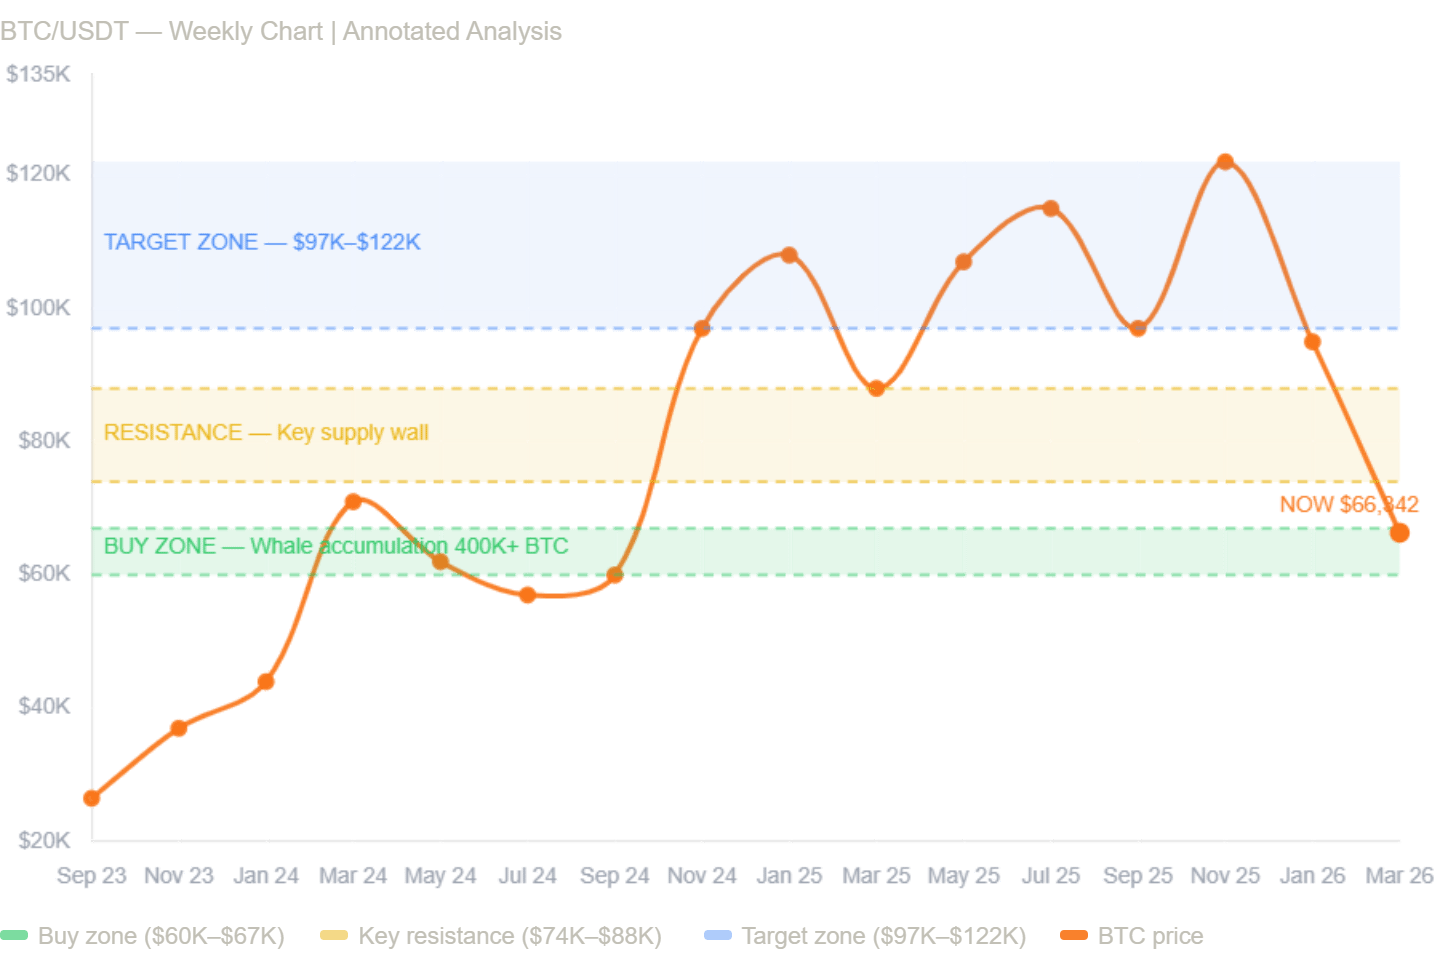
The Three Levels That Matter Right Now
For anyone trying to make sense of where Bitcoin goes from here, the structure comes down to three key price zones.
Zone 1: $64,000-$67,000 - Current Demand Zone
This is where price is right now. On-chain data shows substantial absorption here. The 50% Fibonacci retracement from the 2024 cycle low to the $122,000 high sits at approximately $69,271, making the current range a historically valid accumulation area. The weekly RSI suggests extreme oversold conditions that have historically resolved to the upside.
Zone 2: $60,000 - The Line in the Sand
The $60,000 level is widely considered the most critical support in Bitcoin's current structure. A sustained weekly close below $60,000 would open the door to Fibonacci extension levels at $56,800 and potentially $52,300. This is the level to watch on the downside. It has held as support on every test so far.
Zone 3: $80,000-$97,900 - The Resistance Wall
To confirm a genuine bullish reversal, Bitcoin needs to reclaim the 50-day SMA near $74,600 and then crack the $80,000 psychological level. A sustained close above $97,900 would signal a full structural shift back to bullish. Above that, macro analysts like Henrik Zeberg project a primary target of $110,000-$120,000 for later in 2026.
The Fear & Greed Index Is Saying Something Important
The Crypto Fear & Greed Index currently sits at 36 - in "Fear" territory.
This number matters more than most people realize. Historically, the best Bitcoin returns over a 12-month horizon have come from buying when the Fear & Greed Index was below 30. Not when it was above 70, when everyone was excited and prices were high.
Warren Buffett's most famous quote applies here with almost uncomfortable precision: "Be fearful when others are greedy, and greedy when others are fearful."
Right now, others are fearful. The index tells us that clearly.
What This Means for You
Nobody can guarantee what Bitcoin does next week or next month. The short-term price action is genuinely uncertain - macro headwinds from trade policy, interest rate decisions, and global liquidity conditions can all create additional volatility.
But here is what history has consistently shown:
The periods of maximum fear in Bitcoin's history - the moments when prices were deeply oversold, when sentiment was at rock bottom, when everyone was announcing the end of crypto - those moments were the windows. The windows that closed very fast, and that the majority of investors missed because they were waiting for "confirmation" that never felt comfortable enough.
By the time Bitcoin is back at $90,000, nobody will be writing articles about buying opportunities at $66,000. They will be writing articles about how obvious it was in hindsight.
The chart is clear. The on-chain data is clear. The institutional flows are clear.
What you do with that information is entirely up to you.
This article is for educational purposes only and does not constitute financial advice. Cryptocurrency markets are highly volatile. Always conduct your own research and consult a qualified financial advisor before making investment decisions.