

Bitcoin dropped to around $65.5K on Friday, March 27, revisiting the same support area that previously helped push price back up toward $76K earlier this month. This latest decline triggered heavy liquidations across the crypto market, with nearly $400 million in long positions wiped out. Bitcoin alone accounted for about $172 million of that total.
According to CoinGlass, market data showed a sharp imbalance building before the drop. Open Interest was climbing, while both price and Cumulative Volume Delta were moving lower. This combination suggested that too many traders were positioned long, creating the conditions for a long squeeze. Over the past week, and especially during the latest sell-off, a large portion of bullish leverage appears to have been removed from the market.
Even so, the pressure may not be over yet. The 30-day liquidation heatmap showed another major cluster of leveraged long positions sitting closer to the $64K level. That means price could still dip further if the market moves to clear those positions as well.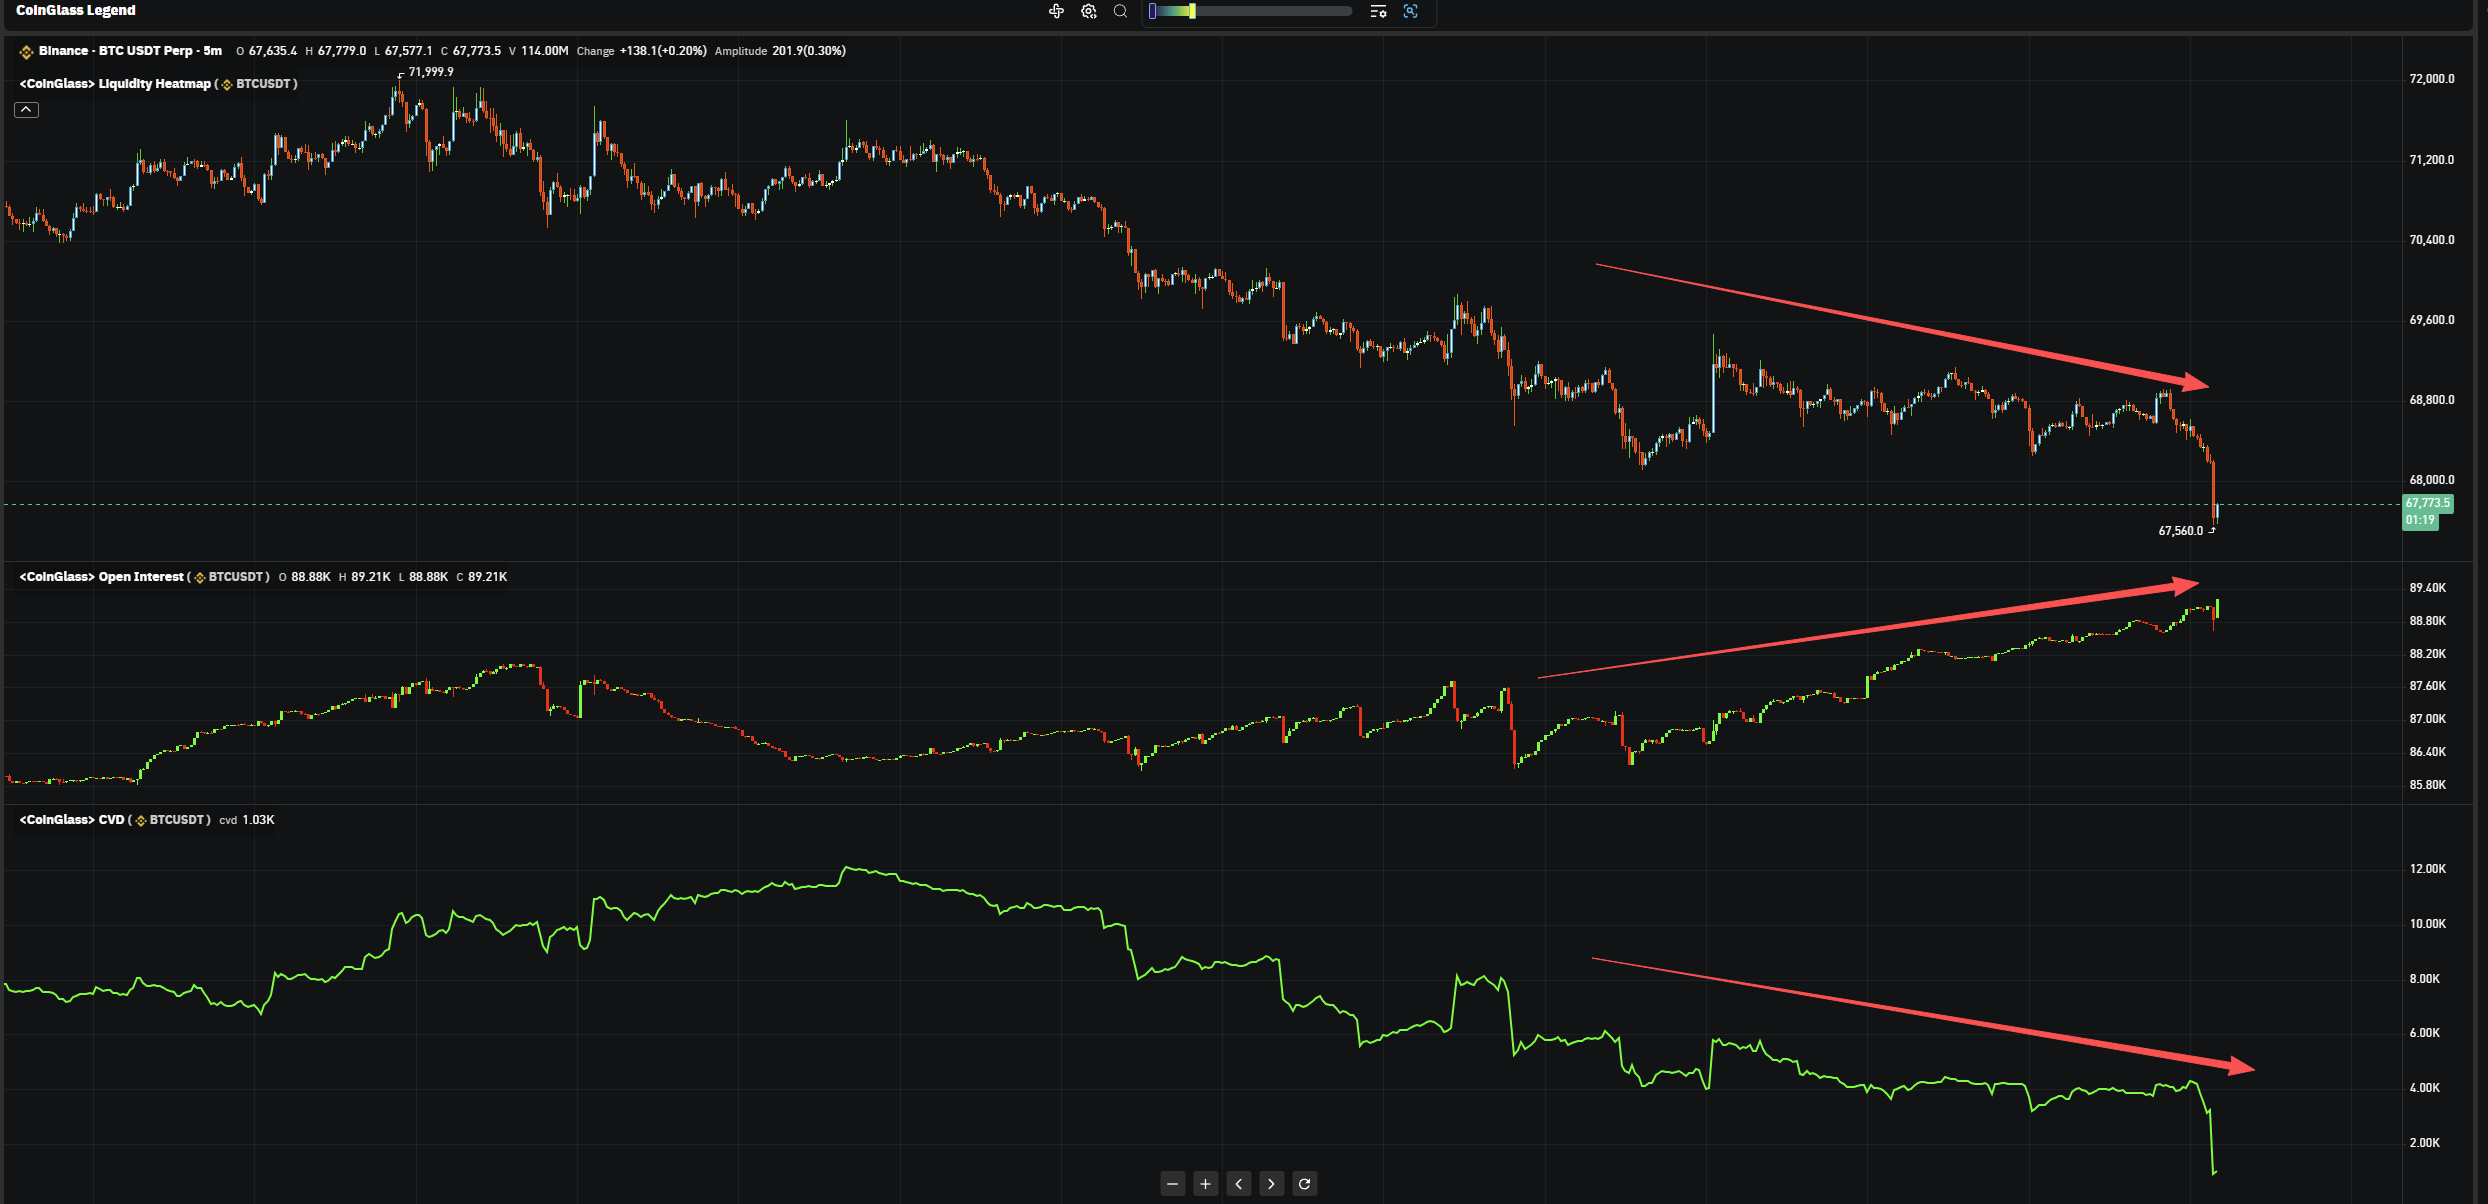
On-chain indicators suggest Bitcoin is currently in a fragile and uncertain phase. Buyers are still absorbing supply, but selling pressure has not disappeared. The market is not in a full distribution phase yet, though it is clearly under stress. This leaves Bitcoin at an important turning point.
Bitcoin’s Internal Battle Is Still Ongoing
One of the most important signals right now is the 30-day net position change of long-term holders. Analyst Axel Adler Jr noted that this metric has remained positive since January 2026. In simple terms, long-term holders as a group are still adding to their positions rather than reducing them. At the time of analysis, long-term holder supply stood near 14.2 million BTC, showing that this group has continued to accumulate despite recent weakness in price.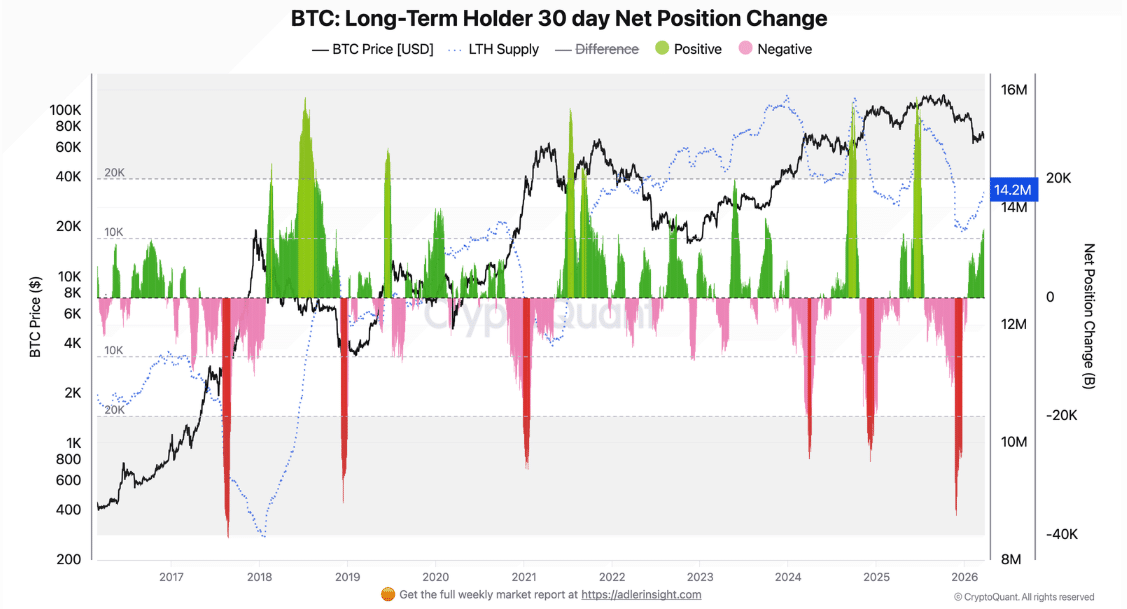
So far, there is no strong evidence that long-term holders have entered a broader selling phase. The last major shift into net selling happened in July 2025, when Bitcoin was trading near $120K.
At the same time, another metric tells a more cautious story. The long-term holder SOPR, or Spent Output Profit Ratio, dropped below 1 in late February. This means that, on average, long-term holders who sold were doing so at a loss. Historically, this kind of reading tends to appear during periods of market stress.
Still, the current setup is not identical to previous bearish phases. Bitcoin is trading at much higher levels than it was during earlier periods when long-term holders were selling at a loss. That suggests the recent loss-taking is likely coming from a smaller group of holders who bought near the 2025 highs, rather than from a broad wave of panic across the entire long-term holder base.
This creates a mixed picture. On one side, long-term holders overall are still accumulating. On the other, a portion of them is selling under pressure and realizing losses. That split is what makes the current market environment so important.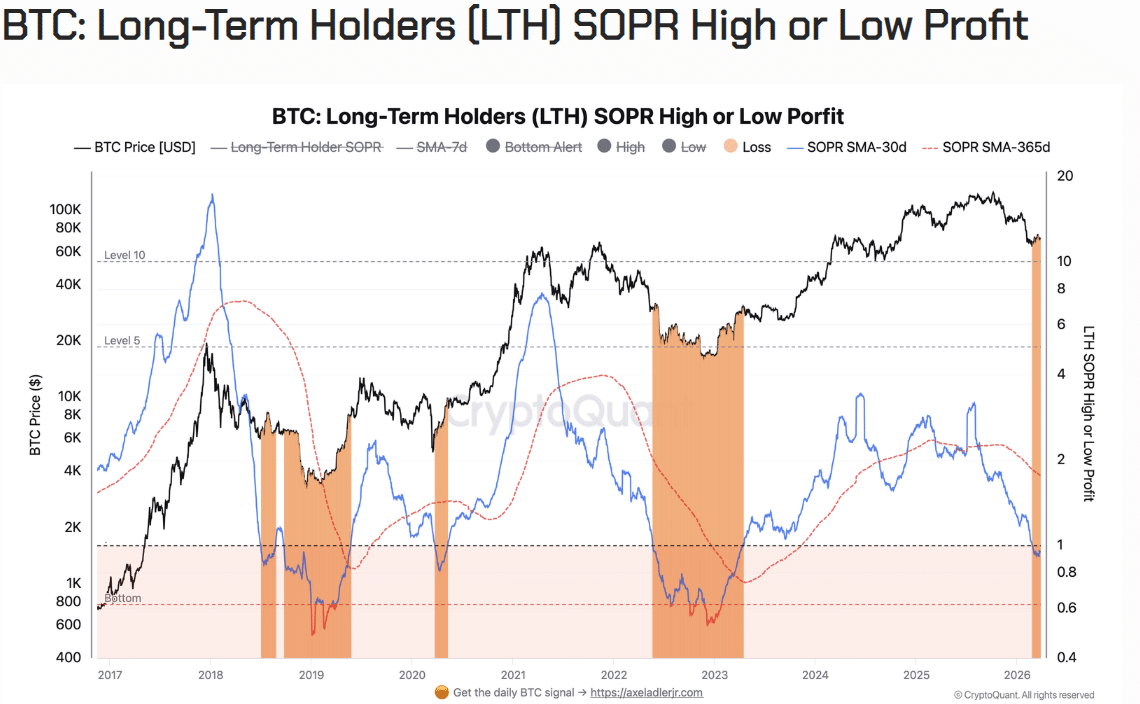
If the 30-day net position change turns negative, it would signal that long-term holders have started distributing more broadly. That would be a major warning sign for Bitcoin and could suggest that deeper downside is ahead.
For now, the market is watching two things closely. The first is whether loss-driven selling becomes more aggressive if prices continue to fall. The second is whether the LTH SOPR can recover above 1, which would suggest that forced selling is cooling off and the market is stabilizing.
Conclusion
Bitcoin sentiment has turned heavily bearish as price retests the $65.6K support zone. Even after the liquidation flush, long-term holder data does not yet confirm a full distribution phase. That is why the 30-day net position change remains one of the most important indicators to monitor in the coming days.