📉 Technical Analysis
📈 Trend & Momentum:
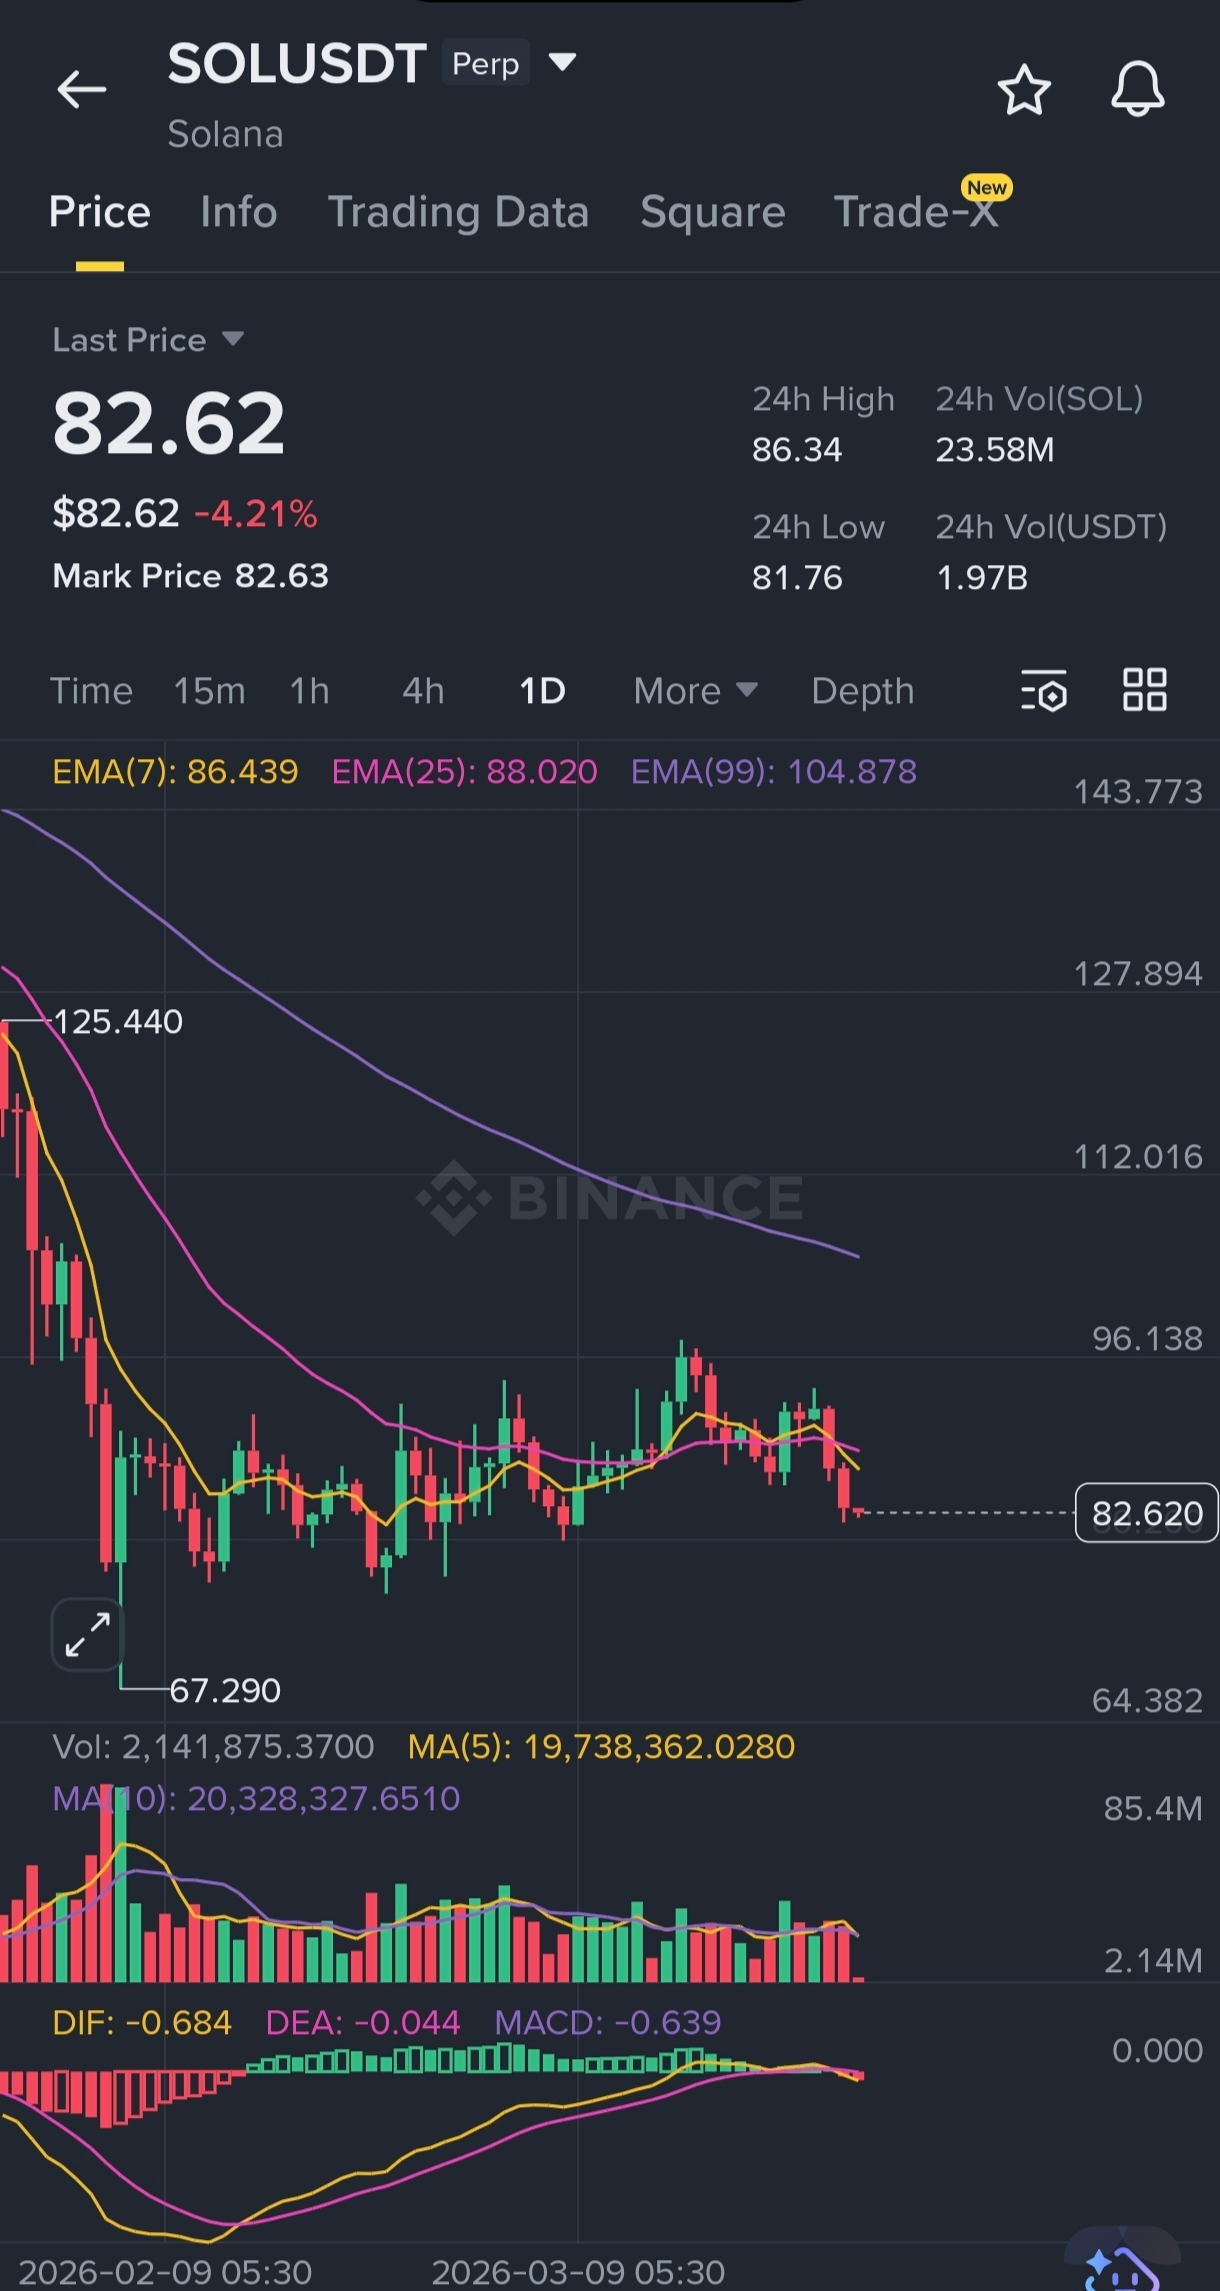
· Current Price: $82.62 (-4.21%) 📉
· Trend: Bearish across all timeframes. Price is below all three EMAs (7, 25, 99), confirming a strong downtrend.
· Moving Averages:
· EMA(7): $86.439 (immediate resistance)
· EMA(25): $88.020 (stronger resistance)
· EMA(99): $104.878 (major overhead)
· Momentum: Price broke below the $82.62 level and is now trading near the bottom of the recent range. The structure is weak with lower highs and lower lows.
🎯 Key Levels:
· 🛡️ Support: $82.62 (current level), $67.29 (next Y‑axis level), $64.38
· 🧱 Resistance: $86.44 (EMA7), $88.02 (EMA25), $96.14 (mid‑range), $104.88 (EMA99)
📊 Volume & Volatility:
· Current Volume: 2,141,875 SOL (extremely low)
· MA(5): 19,738,362 | MA(10): 20,328,328
· Interpretation: Volume has collapsed to about 10% of its 5‑day average, indicating lack of conviction in the current move. This often precedes a continuation of the downtrend or a sharp reversal if volume returns.
📉 MACD:
· DIF: -0.684, DEA: -0.044, MACD: -0.639 (bearish)
· The MACD histogram is negative and diverging, confirming bearish momentum.
📅 Performance Context:
· Today: -4.21% (accelerating decline)
· The market remains in a long‑term bear trend with no signs of reversal.
---
🔮 Price Prediction
⏱️ Short-term (1–3 days):
· Bearish continuation is the most likely path. Expect a test of $82.62** (current low). A break below opens the door to **$67.29.
· Any bounce will likely be capped at $86.44** (EMA7) or **$88.02 (EMA25).
📆 Medium-term (1–4 weeks):
· 🟢 Bullish Case: Only if price reclaims EMA7 ($86.44) with strong volume. Next target would be EMA25 ($88.02) and then $96.
· 🔴 Bearish Case (Base case): Continued downward drift toward $67.29** and possibly **$64.38. A breakdown below $64 would target $50–$55.
---
📊 Trade Plan
📍 Scenario 1: Breakdown Continuation (Short)
· Trigger: 1‑hour or 4‑hour close below $82.50 with volume expansion.
· Entry: $82.40–$82.20 💰
· Stop Loss: $84.00 (above the breakdown zone) 🛑
· Take Profit 1: $67.29 (Y‑axis level) ✅
· Take Profit 2: $64.38 🎯
· Risk/Reward: ~1:5
⚡ Scenario 2: Pullback Short (Conservative)
· Wait for a retest of $86.44** (EMA7) or **$88.02 (EMA25) showing rejection.
· Entry: $86.30–$86.60 (or $87.80–$88.20) 💰
· Stop Loss: Above the respective resistance (e.g., $87.50 for first, $89.00 for second) 🛑
· Take Profit: same targets $67.29 / $64.38 🎯
· Risk/Reward: ~1:4 to 1:6
🔄 Scenario 3: Long (Only with Strong Reversal)
· Longs are not recommended currently. However, if price reclaims **$86.50** with volume and MACD starts to curl up, a scalp long toward $90 could be considered. This is a low‑probability trade.
---
⚠️ Risk Management:
· 📉 Low Volume Trap: The current low volume means price can move sharply in either direction on any news. Use tight stops and avoid heavy leverage.
· 📊 Key Level to Watch: $82.62. A daily close below this confirms the next leg down toward $67.
· ⏰ Timeframe Alignment: This is a daily chart analysis, so trades may take several days to play out. Be patient.
· 🧠 Avoid Bottom‑Fishing: The trend is clearly down. Trying to catch a reversal is high‑risk; shorting or staying in cash is more prudent.
---
📝 Summary: SOL is in a clear downtrend, trading below all key EMAs with bearish MACD and collapsed volume. The path of least resistance is lower, with immediate focus on the $82.62 low. A breakdown would likely send prices toward $67. Shorts are the preferred strategy; longs should wait for a confirmed reclaim of $86.50.
TAKE TRADE FROM HERE 👇
