The TAO arrow is currently moving within an ideal technical scenario that combines healthy correction and testing strong demand areas. Based on Smart Money Concepts (SMC) indicators and moving averages, here are the details:
1. The technical reading of price movement:
Correction phase: After a strong rise, the price entered a calm corrective wave to test lower liquidity areas. This behavior is considered positive to cool the indicators before resuming the rise.
Moving Averages (EMA Cloud): The chart shows that the price is currently resting on the moving average cloud (20, 50, 100, 200). Staying above the 100 and 200 moving averages (the lower lines) strengthens the long-term bullish trend.
2. Entry and Support Area:
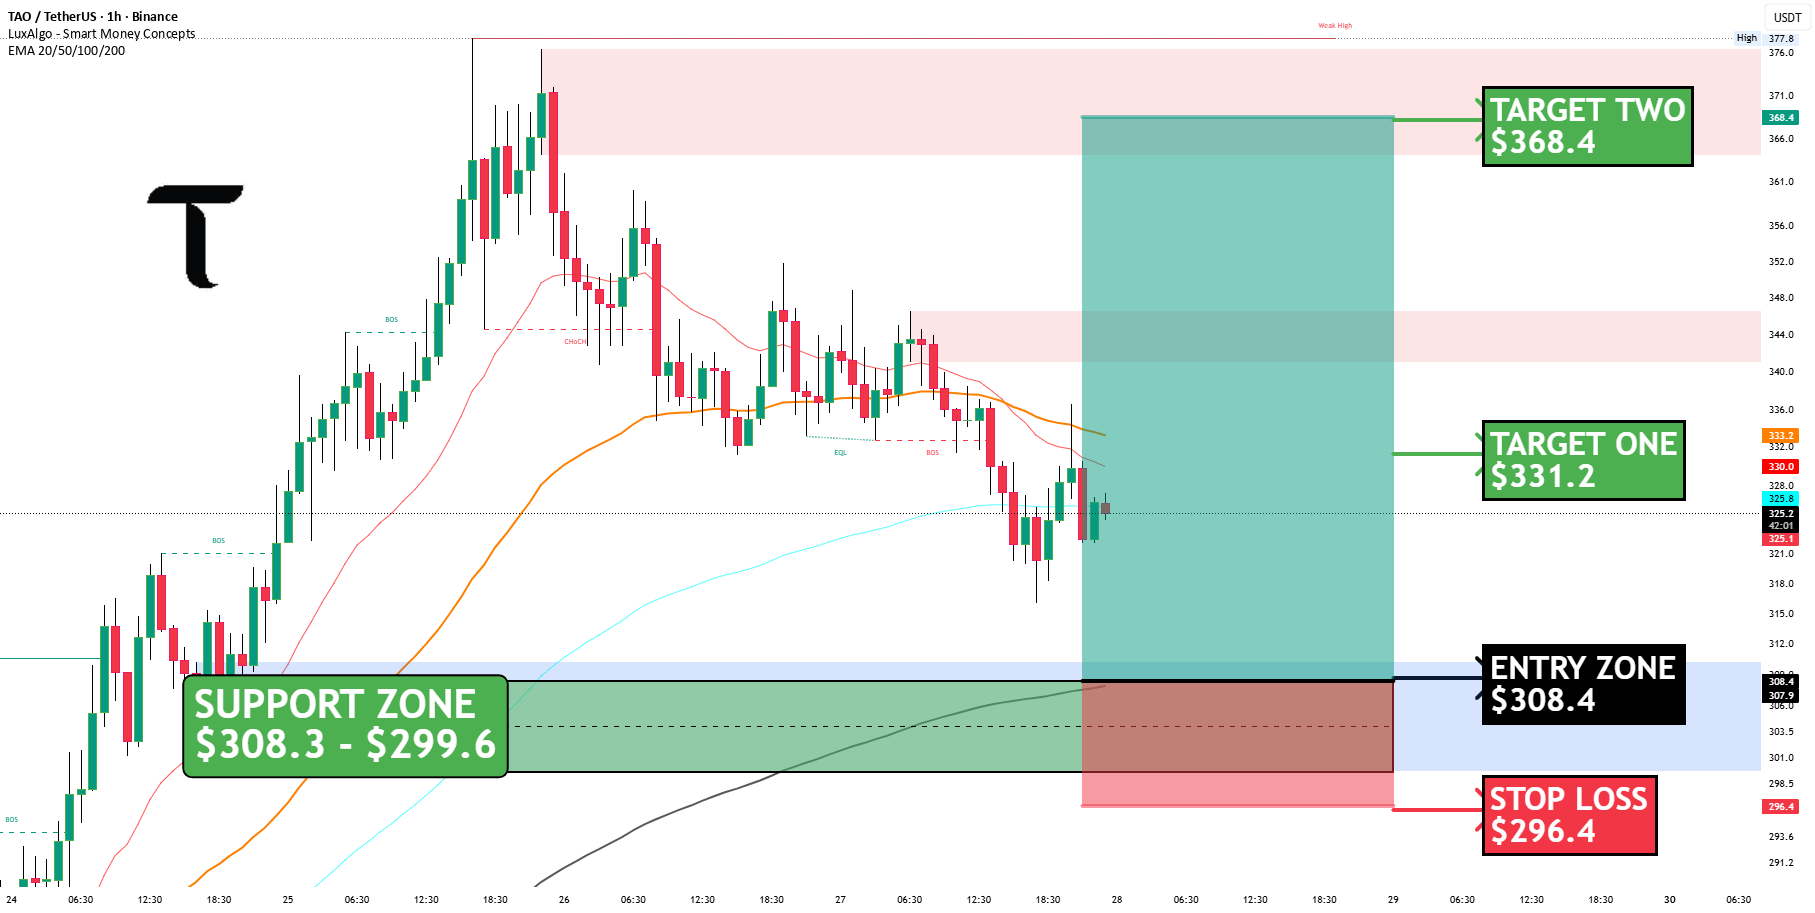
Support Range: A solid support area has been identified between $308.3 and $299.6. This area represents a "demand zone" where institutional buy orders are concentrated.
The ideal entry point: the level $308.4 represents a strong technical pivot point for entering "Long" positions with confirmation of the rebound.
3. Price Targets and Time Frame:
The first target ($331.2): represents a nearby resistance level and an initial profit-taking area for traders using the "scalping" or day trading system.
The second target ($368.4): represents a targeting of the previous peak and a test of the upper supply areas.
Reaching this target means fully regaining the upward momentum.
4. Risk Management:
Stop loss: The stop loss level has been set at $296.4. This level is carefully studied as it lies just below the support area; breaking this level means the current bullish scenario has failed and the trend has turned negative.
Summary:
Pair $TAO in an excellent technical "buy" area, provided the price remains stable above the $300 area. Trading in these areas offers an excellent "risk to reward" ratio.
From here, trade $TAO
