📊 Summary of Key Results
### **Key Signal**
- **Analysis:** **2 Fractals** were detected across 3 time frames (1H, 4H, 1D)
- **Strongest Level:** One fractal on 1D (the strongest)
- **Support Levels:** Cluster Resistance at **$72,026** (very close to the current price)
🎯 Fractal Statistics
| Time Frame | Number of Fractals | Time Period |
|:---:|:---:|:---:|
| **1H** | 7 | 34 hours |
| **4H** | 3 | 28 hours |
| **10** | 8 | 37 hours |
**Double Blocks:** 1 | **Triple Blocks:** 1
## 💡 Revealed Strategies
### **1️⃣ Strategy 1 (Strong)**
- **Resistance:** $72,026
- **Percentage:** 9.40+%
- **Frames:** 1H, 4H, 1D ✅
- **Classification:** Institutional Level
### **2️⃣ Strategy 2**
- **Resistance:** $76,000
- **Percentage:** 15.43+%
- **Frames:** 1D, 10 ✅
- **Status:** Secondary
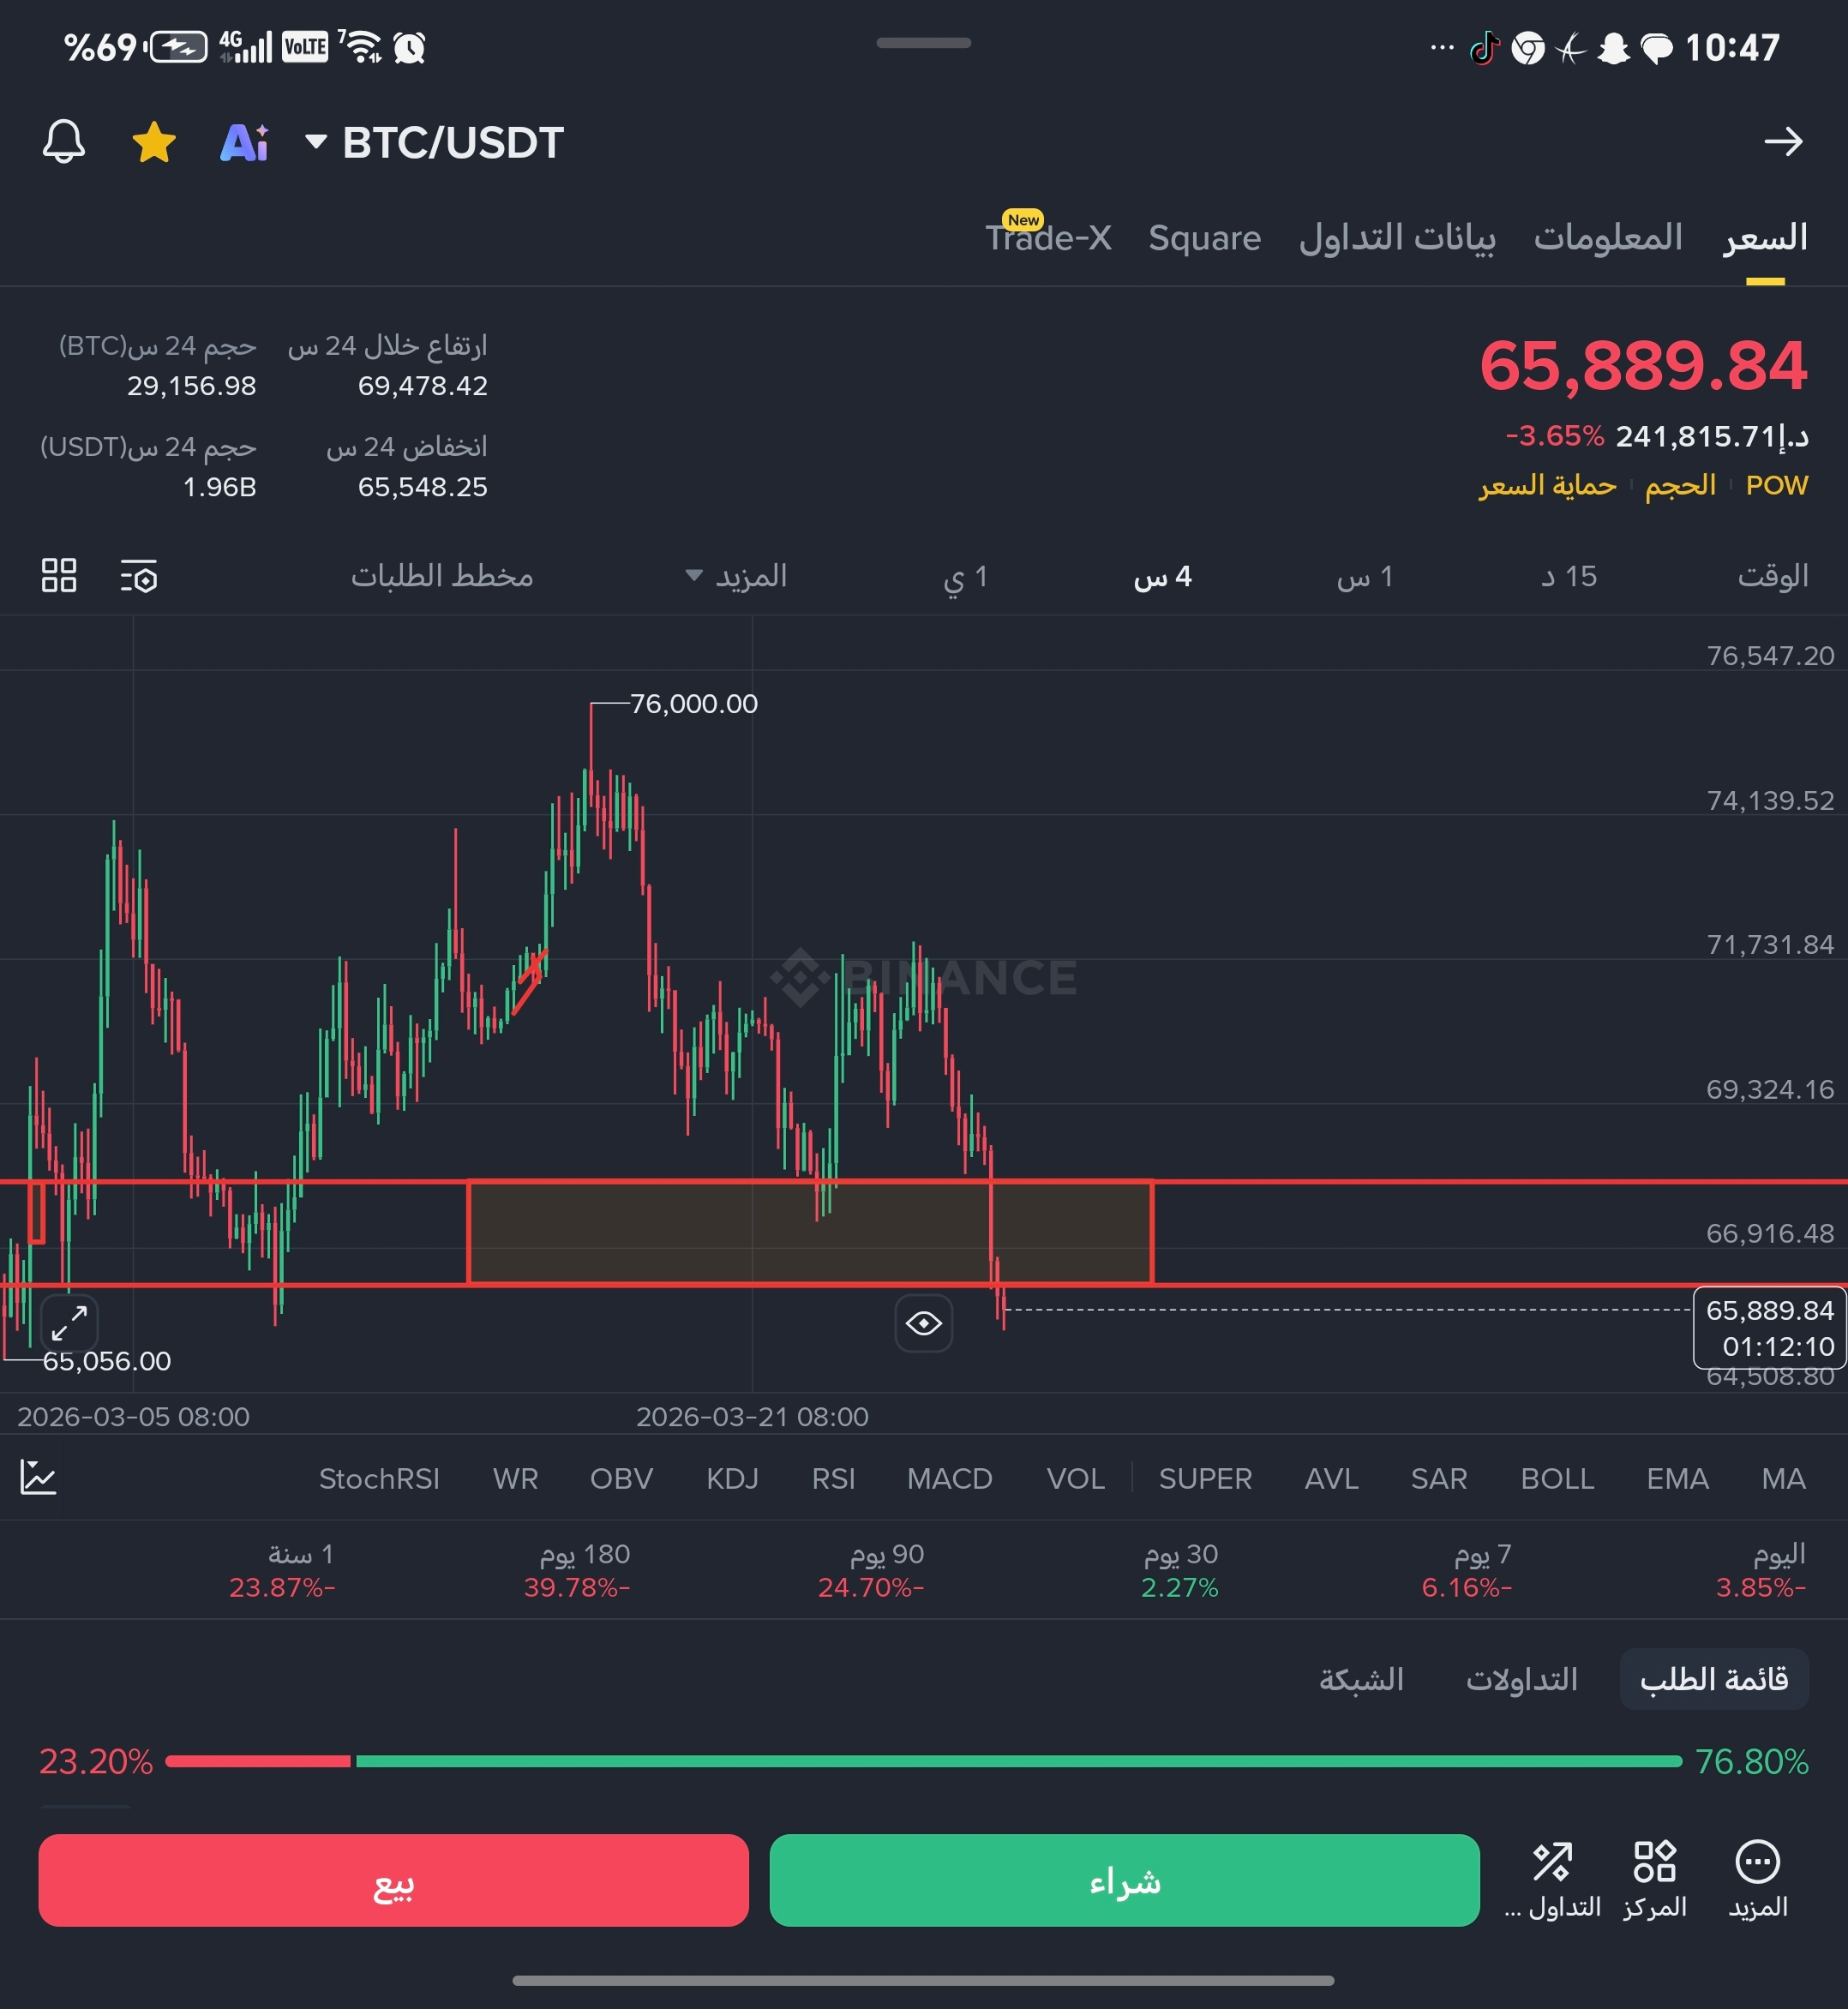
## 📈 Current Technical Analysis (from the chart)
**Current Price:** 65,889.84 USDT (-3.65%)
### **Critical Areas:**
- **Cluster Resistance:** $72,026 ← first target (expected)
- **Upper Resistance:** $76,000 ← second target
- **Support Zone:** $65,056 - $66,916 (current defined)
### **Confluence Signals:**
- ✅ **1D Fractal** aligns with Cluster Resistance
- ⚠️ Current price below resistance by about **1,650 points**
- 📊 Bill Williams Fractals confirmed on 3 frames
## 🎲 Probabilistic Scenario
**Recommendation:**
- **Bias:** Mid-Confidence Bullish
- **Entry Zone:** $65,500 - $66,500 (current area)
- **Target 1:** $72,026 (9.40% potential profit)
- **Target 2:** $76,000 (15.43% potential profit)
- **Stop Loss:** Below $65,056
## ⚠️ Important Notes
1. **Institutional Fractals** indicate potential turning points
2. **Triple Cluster at $72,026** = strong confirmation of resistance
3. **Current price** in Support area, suggesting the start of a bullish movement
4. **Not a Buy or Sell Recommendation** - Use additional indicators for confirmation (MACD, RSI, Volume)