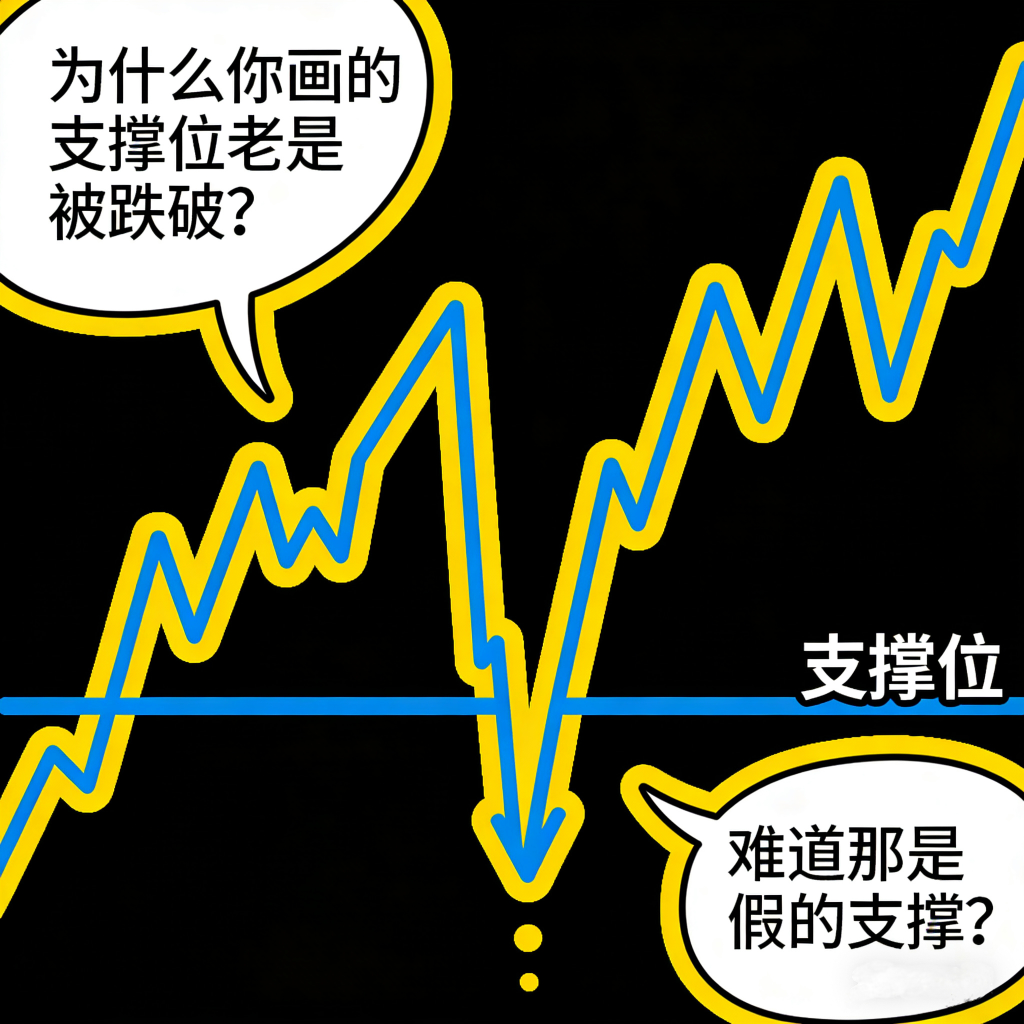
1. Is the "defense line" you drew considered "fat meat" by the main players?
Many traders are accustomed to drawing a few lines horizontally on the candlestick chart, believing that prices will stabilize once they drop to that level. What happens instead? The market slices through like cutting cream, triggering your stop-loss in the process.
The truth is: the "iron bottom" you see is actually a liquidity mining area marked by the main players to "batch liquidate" stop-loss orders.
2. The failure of support levels and liquidity hunting
From the perspective of institutional traders, support levels are not meant for buying, but for observing liquidity distribution.
Liquidity accumulation: A large number of retail stop-loss orders usually pile up below obvious support levels. For large capital, breaking the support level can trigger these sell orders, allowing them to accumulate at low prices with low slippage.
Consensus decay: If a support level is repeatedly tested (bounced several times without rising), it indicates that the bulls' active buying is being consumed. Physically, this is called metal fatigue, and in trading, it's called 'bull exhaustion.'
Order flow imbalance: When macro-level negative news hits, the order volume at the support level cannot withstand the overwhelming selling pressure.
IV. Be cautious of the following three types of 'paper-thin support'!
To survive in the crypto space, be vigilant when encountering these 'support buying methods':
'First touch' means full position: Jumping into a full position at the first drop without observing a volume reduction stop signal is a high-risk behavior.
Superstitious about 'round numbers': For example, 60,000, 80,000 are such round numbers that retail investors love to watch, while the main players like to go against them.
Ignoring the 'time dimension': If the price hovers at the support level for too long without bouncing back. Remember: prolonged defense will inevitably fail!
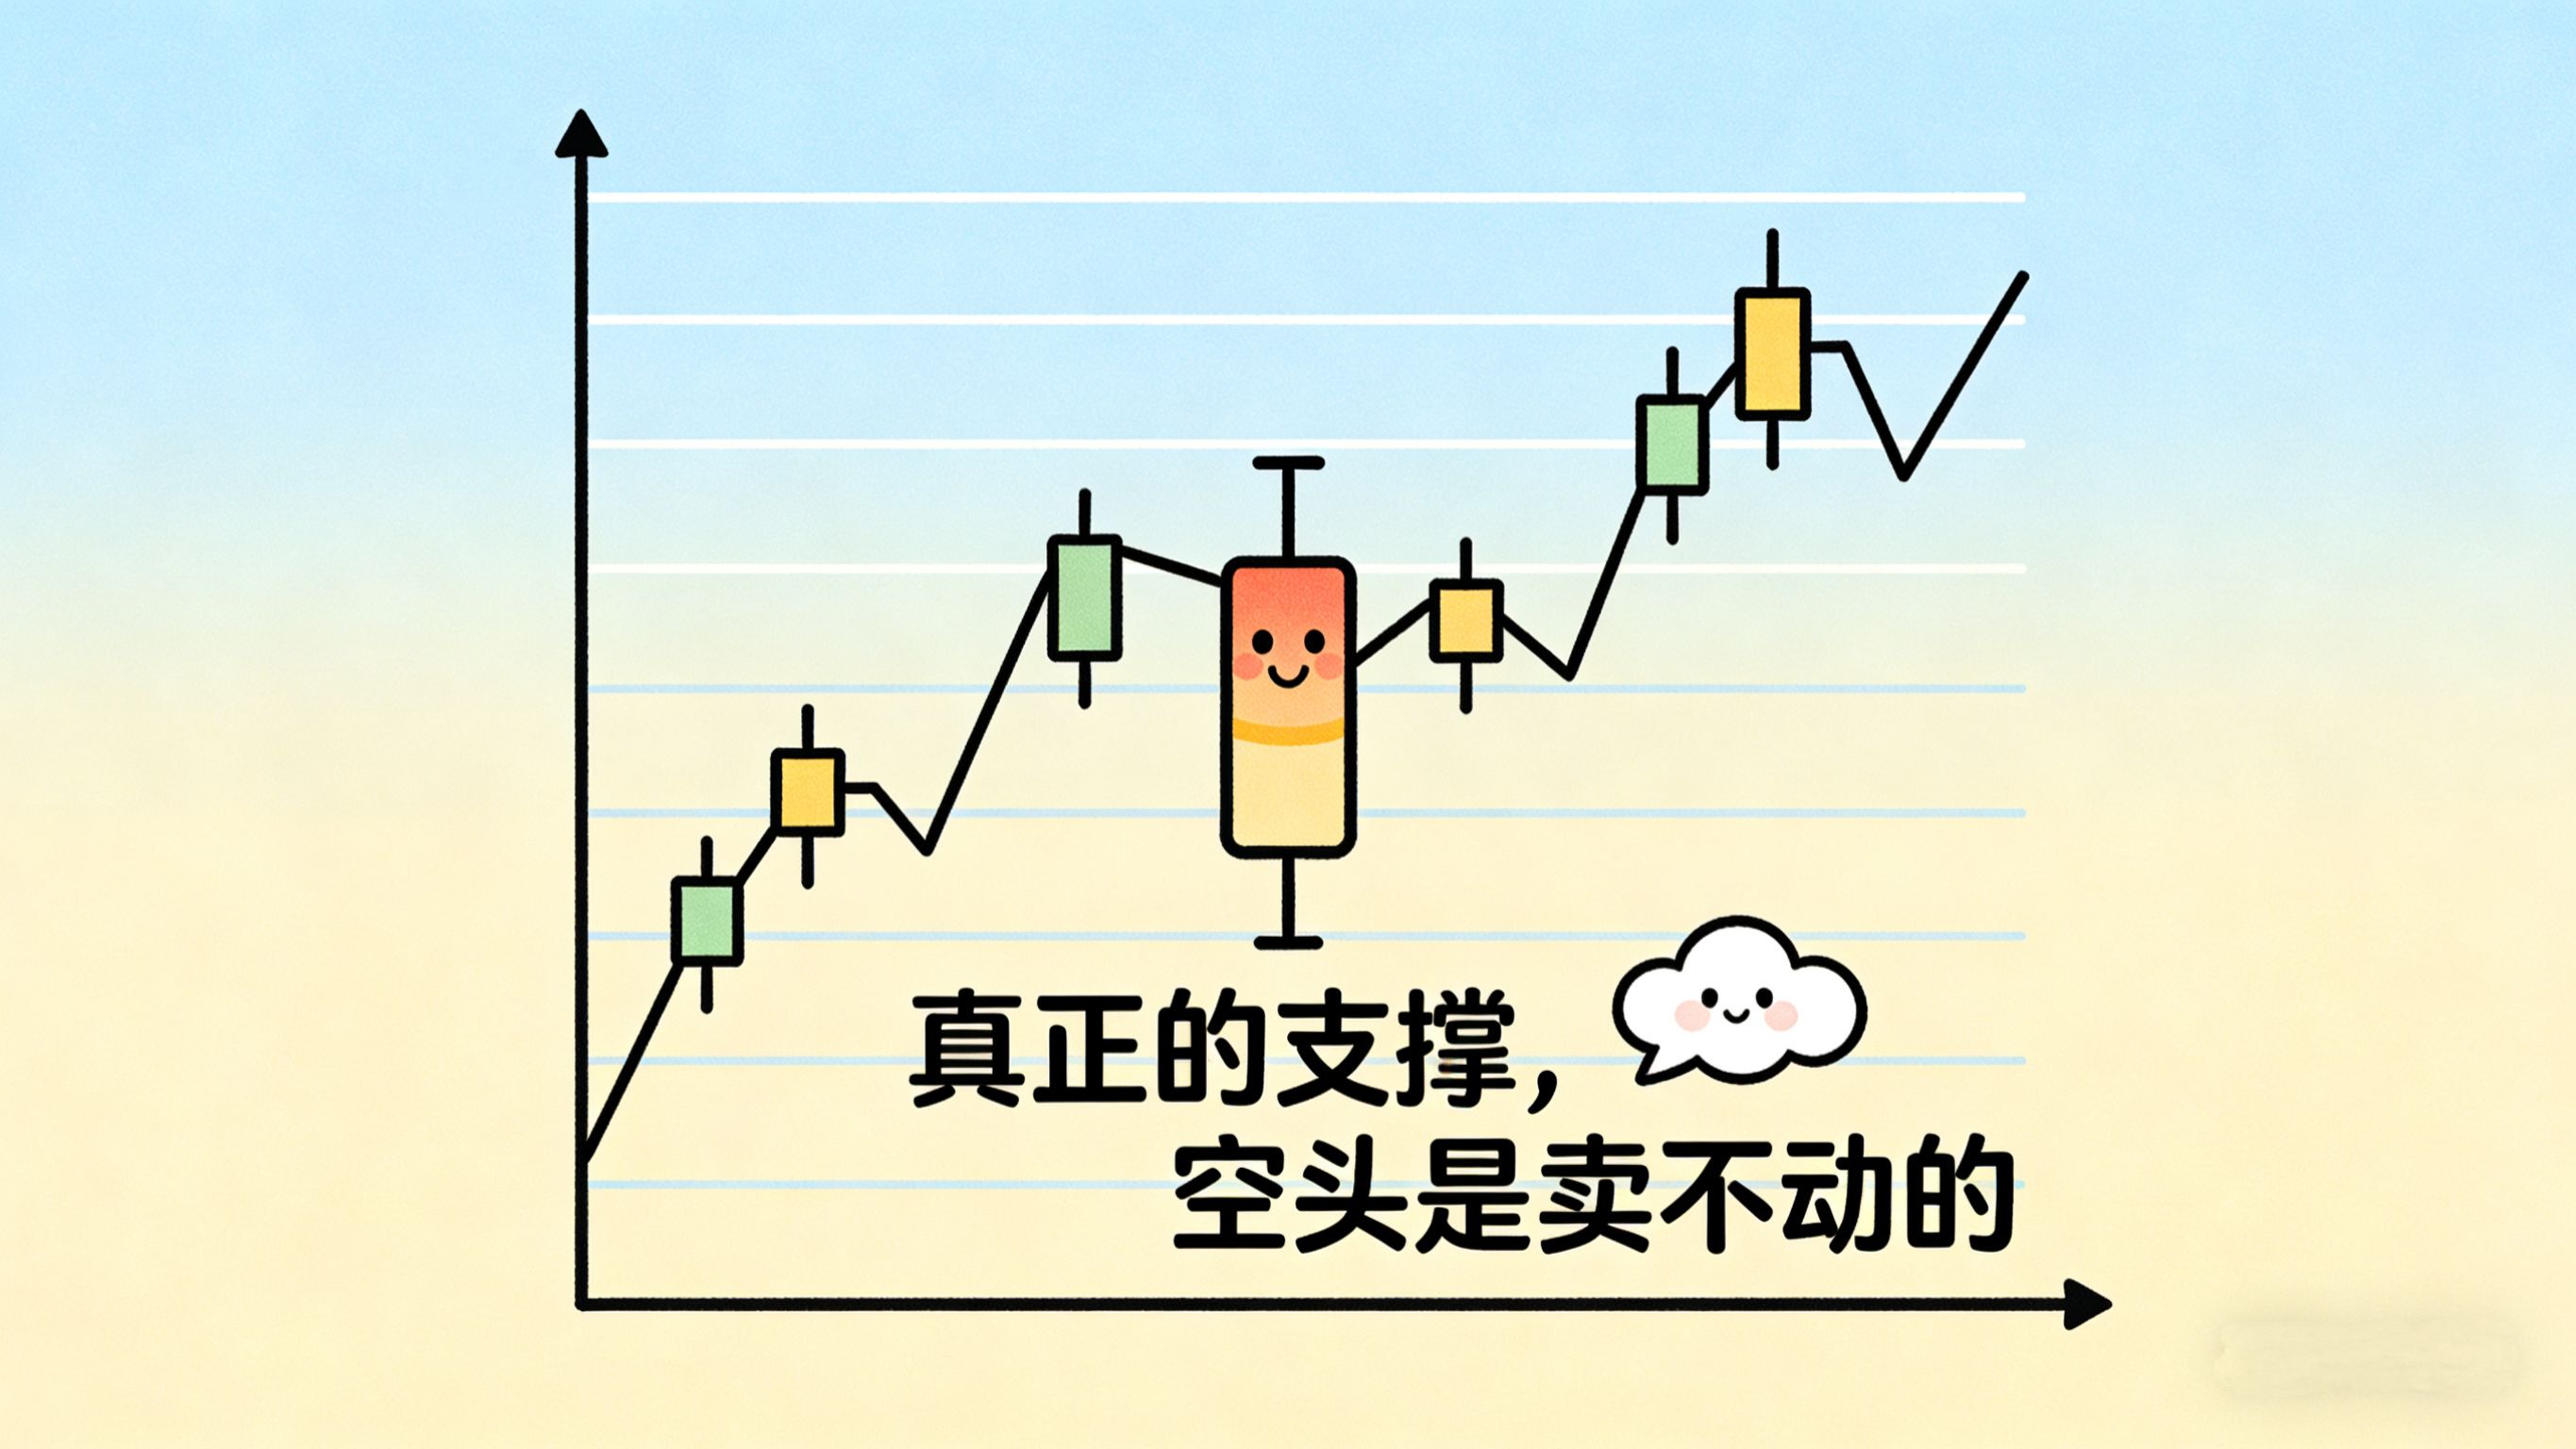
True support is not about how well the lines are drawn, but whether the price stops falling when it reaches there, judging whether the bears are 'unable to sell.'
IV. Logical summary and next article preview
Previous review: We clarified that the candlestick chart is just a footprint left by capital. Don't be superstitious about patterns; focus on the essence of capital.
Core of this article: We have uncovered the truth about 'false support'; many support levels are just liquidity bait. If bulls do not show a strong desire to 'jump the gun', then the support is as fragile as paper.
Next article preview: Since some supports are false, why do some market prices start to soar before reaching the support level?
In the next article, we'll discuss: Prices rebounding before reaching the support level—are there people secretly 'jumping the gun'? Don't miss the upward trend just because you're waiting for that 'perfect entry point'!
This article was first published on Binance Square, aiming to dismantle the personal practical trading system and logic. It is not investment advice; the market has risks, and liquidity changes rapidly. Maintain independent thinking and protect your capital!